Natural Tsunami Wave Amplitude Reduction by Straits – Seto Inland Sea
 , Andrey Marchuk 1, 2, Konstantin Oblaukhov 1, Mikhail Shadrin 1
Adv. Sci. Technol. Eng. Syst. J. 7(6), 161–166 (2022);
 DOI: 10.25046/aj070616
Seto Inland Sea is situated between Japanese islands Honshu, Kyushu, and Shikoku. It is separated from the ocean by the Bungo Channel, Kii Channel, and other narrow straits around Shikoku Island. The objective of the article is to draw the attention to the question of how well the coastal population and infrastructure of those locations are protected against a tsunami wave appearing in the area of Nankai through offshore Japan and consequently make informed decision about strengthening the protections if needed. This question is critical because strong underwater earthquakes are expected according to the major earthquake repeatability in this subduction zone. Hence, the influence of strait width and tsunami wave period to the wave amplitude change after passing a strait was studied through the application of numerical modelling. Both models of geometry of computation domain with the flat bottom and the real bathymetry of the area under study were used. Numerical modelling was based on nonlinear shallow water system, commonly used in tsunami related studies. All calculations were made at a personal computer equipped with the hardware code accelerator – FPGA (Field Programmable Gates Array) Calculator, which had been recently introduced by the authors. A series of computational experiments, both with model straits and in the water area around southern part of Japan, have shown that when a tsunami wave passes through the strait, its height is significantly reduced, providing better tsunami safety regulations of the population of the inner seas separated from the ocean by narrow straits. At the same time, longer tsunami waves retain a larger amplitude after passing through the strait compared to shorter ones. Result of the paper consists of numerical study of the influence of narrow straits on the maximal heights of tsunami wave. Qualitative corollaries between length of tsunami and reduction rate of the wave amplitude after passing a strait should help warning services to properly evaluate tsunami danger in water areas separated from tsunami source by a narrow strait.
1. Introduction
This paper is an extension of work originally presented at the conference OCEANS 2021: San Diego – Porto [1].
Tsunami waves, usually created by large underwater earthquakes, are propagated due to the gravity and grow substantially in amplitude as they approach the shore. One of the tasks of a tsunami warning service is to identify coastlines by the level of threat once a tsunami has been confirmed and act accordingly. Namely, it is critical to determine in which areas of the coastline high waves threatening local population and infrastructure are expected and hence evacuation must be announced, and in which areas tsunami damage may be minimal. Observations of tsunamis show that after a wave passes through a narrow strait, its height decreases significantly. Therefore, an area separated by a narrow strait from the open ocean is somewhat protected from tsunami impacts, unless the source of the tsunami is located in that area.
As it’s suggested in literature after studies of historical records (see [2]), a major underwater earthquake (following by tsunami wave) is expected at Nankai through offshore Japan. This article evaluates the possible impact of such event to the Seto Inland Sea, bounded by the Honshu, Kyushu, and Shikoku islands of Japan. The bottom relief of the studied water area is given in Figure 1. Tsunami wave can arrive in this water area only through the Bungo Channel in the south and Kii Channel in the north. These channels are narrow enough to reduce valuably of the amplitude of tsunami wave. To study numerically this phenomenon, the wave parameters related to the initial seabed displacement at tsunami source of the event, which took place in this area nearly 300 years ago was used but with a rather lower displacement. Such approximation, shown in Figure 2, has been proposed in [2] on the basis of available historical records.
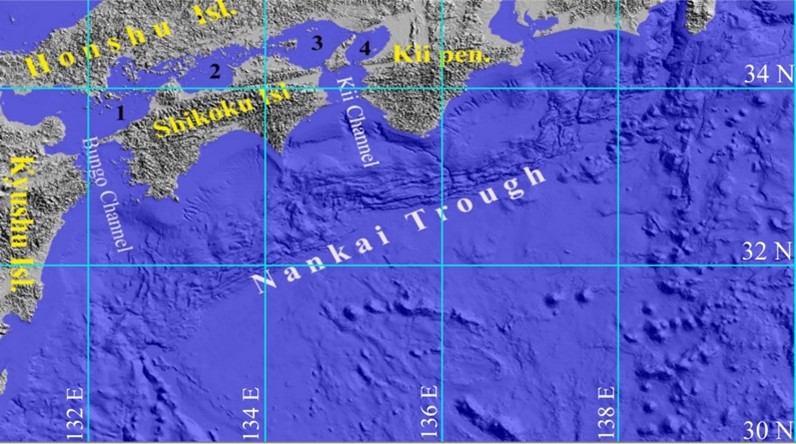
Figure 1: Visualization of the digital bathymetry for the water area under study. Seto Inland Sea surrounded by Shikoku, Honshu and Kyushu Islands is divided in sectors 1 – 4
The goal of the numerical study was to understand the influence of the size of tsunami source to amplitude reduction rate while the wave is passing through a narrow channel. Model tsunami sources considered had time periods from 5 to 15 minutes. Such numbers correspond to sources of an elliptic shape having short axis variation interval between 60 km and 200 km. Note that even trans-oceanic waves with that long period can arrive in the region under the study.
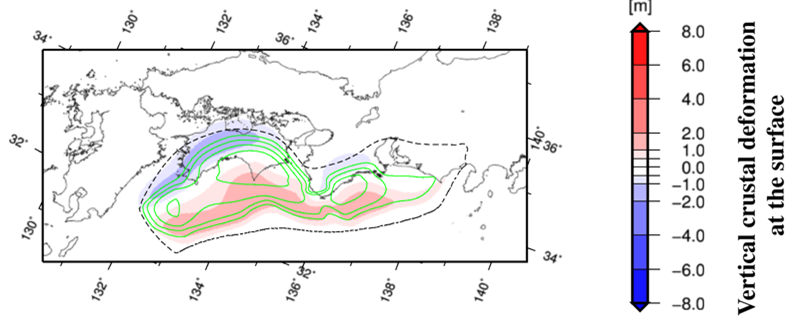
Figure 2: The expected vertical bottom displacement for MW=8.66 earthquake in Nankai subduction zone [2]
Rest of the paper is arranged as follows. The governing equations (along with the initial shape of the wave) are first introduced and the auxiliary numerical tests concerning straits of model shape are described. In particular, the influence of the strait width and wavelength on the wave amplitude is evaluated. The detected impacts are then confirmed for the real digital bathymetry of the Nankai Through and Seto Inland Sea. The obtained results are then discussed.
2. Design of Numerical Experiments
2.1. Model equations
For numerical modeling of tsunami wave propagation, a nonlinear mathematical shallow water system was chosen without considering external forces (bottom friction, Coriolis force, etc.), except the gravity [3]:
where H(x,y,t)=η(x,y,t)+D(x,y) is the total height of water column, η being the sea surface disturbance (wave height), D(x,y) – depth (which is supposed to be known at all grid points), u(x,y,t) and v(x,y,t) are components of water flow velocity vector, g – acceleration of the gravity. Note that this approximation is widely used for tsunami simulation [4, 5].
2.2. Model Assumptions
The shallow water model (1)-(3) used for numerical modeling of tsunami propagation assumes that the wave length is significantly (at least an order of magnitude) greater than the depth of the water area where the wave is traveling. It follows that the velocity c of tsunami propagation does not depend on its amplitude and is determined only by the water depth by the Lagrange formula [3]: . Due to the constancy of the tsunami wave period during propagation, its length in the area with constant depth also remains constant. Therefore, in such areas, reasoning in terms of “wave period” and “wave length” is equivalent. In areas with variable depth, such substitution of concepts is incorrect.
2.3. Instrument for Numerical study
In the Method Of Splitting Tsunami (MOST) software package [4,6] (official tsunami modeling instrument of the USA Tsunami Warning Centers) a numerical calculation of shallow water system is based on the splitting method. The system is solved numerically in two steps. During each step the changing of variables only along one space direction is a subject of the study. The essence of the method is that the solution is sought as the result of the variables behavior in the course of the sequential solution of two auxiliary one-dimensional systems. In the present paper a parallel implementation of McCormack’s scheme, which has the second order of approximation [7], is used. As the earlier numerical experiments [8] have shown, the proposed software allows finding solutions of the shallow water equation system with the required accuracy. Due to the hardware acceleration, high performance is achieved when using a personal computer [8].
2.4. Auxiliary Numerical Tests
In order to study the process of passage of a long wave through narrow straits and to identify the degree of influence of the strait width and the wave period on the wave parameters beyond the strait, a series of model computational experiments were conducted. In them, the channel (strait) was represented by straight shorelines converging at an angle of 90° until the width of the strait becomes equal to the given “width”. After this narrowest point of the strait (“bottle neck”), the shorelines begin to diverge at the same angle 90° (Figure 3).
Computation domain, given in Figure 3, represents a 1000×1000 km square with a constant depth of 1000 m. The two “water reservoirs” having the shape of triangles are connected by a narrow strait with a width of 40 km (as shown in Figure 3) and also 20 km for alternative numerical tests. The dry land, the boundaries of which reflect tsunami waves, is colored in green (Figure 3). The MacCormack difference scheme [7] was realized on FPGA PC board [8] for numerical modeling of tsunami wave propagation. The use of this particular algorithm is not a determining factor in this study. For calculations, any other correct method of solving the shallow water equations could be used, for example, the basic one in MOST software package [4,6].
The initial tsunami wave was generated using boundary conditions on the left boundary of the region, where during the wave period tp the vertical displacement of the water surface η and the horizontal velocity components of the water flow were set by the following formulae:
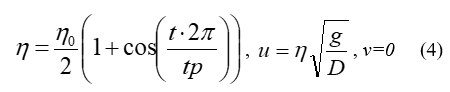
here the variable t belongs to the interval 0<t<tp. Period of the tsunami wave is characterized by the quantity tp, and η0 sets the initial wave height of its crest. Such a way for wave generation was developed and tested in [9]. As a result, a tsunami wave is generated at the left boundary, which has a height η0=1 m and a period tp, moving to the right of this boundary (Figure 3). In numerical calculations, the wave period was set to 300, 600 and 900 seconds. The simulation result is the distribution of tsunami height maxima over the entire computational domain. Figure 3 shows the results of calculations of the wave with a period of 300 seconds through the strait with a width of 40 km at the narrowest point. The height of isolines in Figure 3 (and all other figures, showing results for model straits) are drawn with interval of 5 cm.
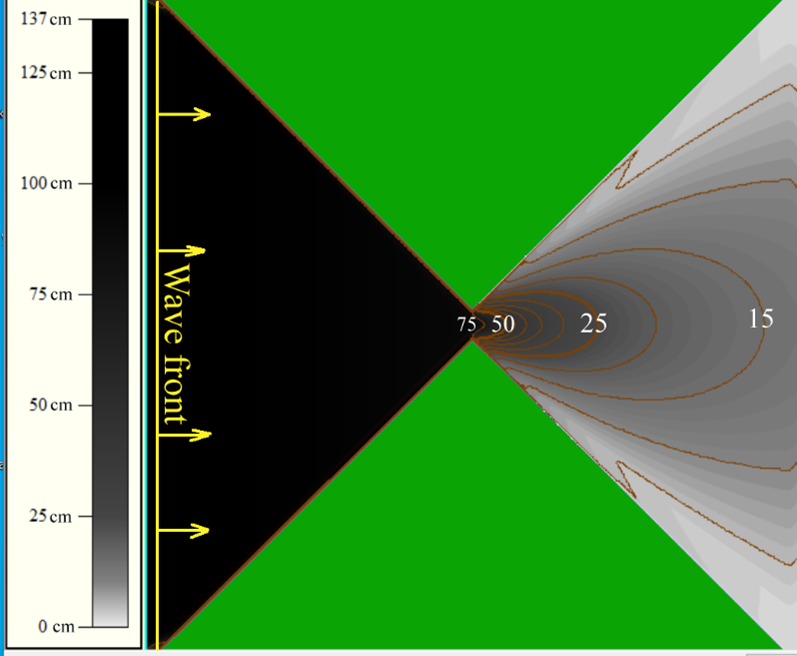
Figure 3: Numerically obtained distribution of the tsunami height maximums. Wave period is 300 sec., strait has 40 km width. The entire area is 1000×1000 km square. Interval (in height) between height isolines is equal to 5 cm
Figure 3 shows that the tsunami height, initially equal to 100 cm, begins to decrease quite rapidly just after the passage of the “bottle neck”, which has a width of 40 km. At the same time, the radiation of wave energy in the right half of the calculation region has a narrow directivity (see Figure 3). To study the effect of wavelength (period), the authors conducted two more computational experiments at the same strait for the passage of the tsunami with a period of 600 and 900 seconds. Figure 4 shows the distribution of maximum heights resulting from the passage of a long wave with a period of 600 sec through the same strait.
Another calculation simulating tsunami passage with the period of 900 sec through the same model strait was also conducted. The results are shown in Figure 5.
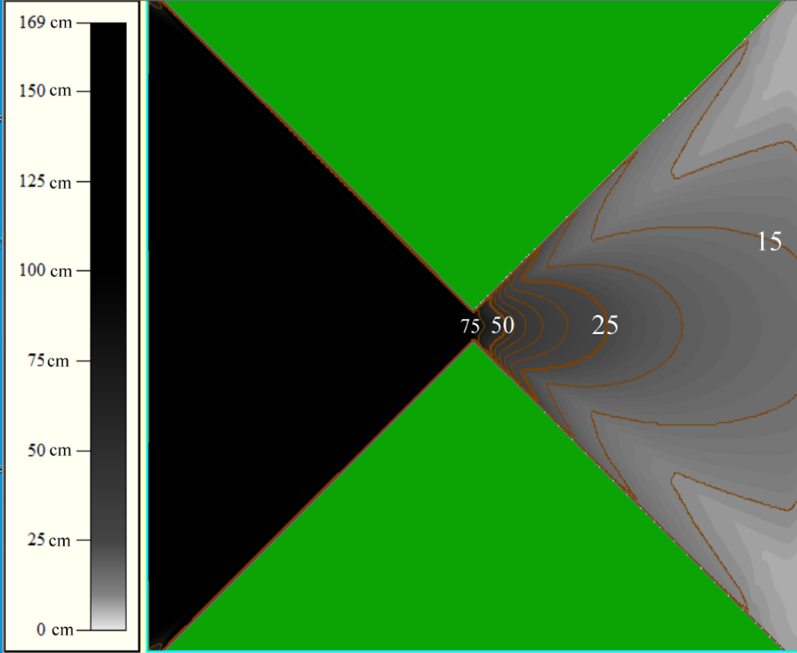
Figure 4: Numerically obtained distribution of the tsunami height maximums. Wave period is 600 sec., strait has 40 km width
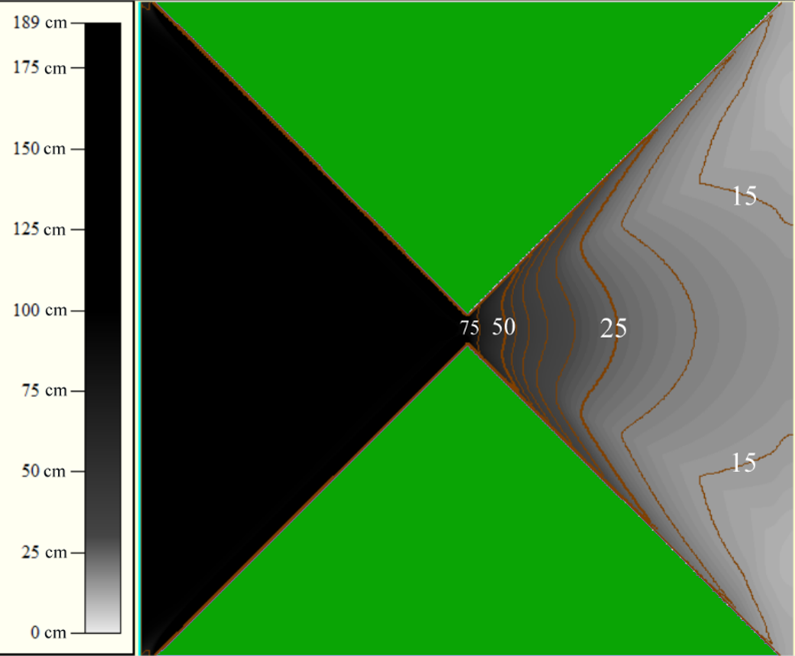
Figure 5: Numerically obtained distribution of the tsunami height maximums. Wave period is 900 sec., strait has 40 km width
Figures 3-5 show that, as the length (period) of the tsunami wave passing through the 40-km wide strait increases, the radiation sector of the wave energy expands in the right subarea (after the wave has passed the “bottle neck”). In case of a longer wave, a slower decrease in the tsunami amplitude is observed with distance from the narrowest point of the strait. In particular, for a wave with a period of 300 seconds, the tsunami height in the center of the right boundary of the computational domain was about 14 cm. For the wave with the period of 600 sec – 16 cm. And for the longest wave (with a period of 900 sec) – 17 cm (Figures 3 – 5). Note that the increased amplitude of the tsunami at the boundaries of the strait is a consequence of the wave reflection from the shore.
During the next series of computational experiments, the width of the narrowest part of the strait was reduced to 20 km, i.e., half as much as in the first series. At the same time, the angle of convergence of the shorelines remained equal to 90°. The parameters and direction of propagation of the generated wave remained the same. Figure 6 shows the distribution of tsunami height maxima with a period of 300 s as it passed through a 20 km wide strait.
Comparison of Figures 3 and 6 shows that the tsunami height decreases significantly faster after the wave passage of the 20-km wide bottle neck compared to the case of the 40-km wide strait.
Figures 7 and 8 show the distribution of maximum tsunami heights when simulating tsunami waves with periods of 600 and 900 sec for the 20 km wide strait.
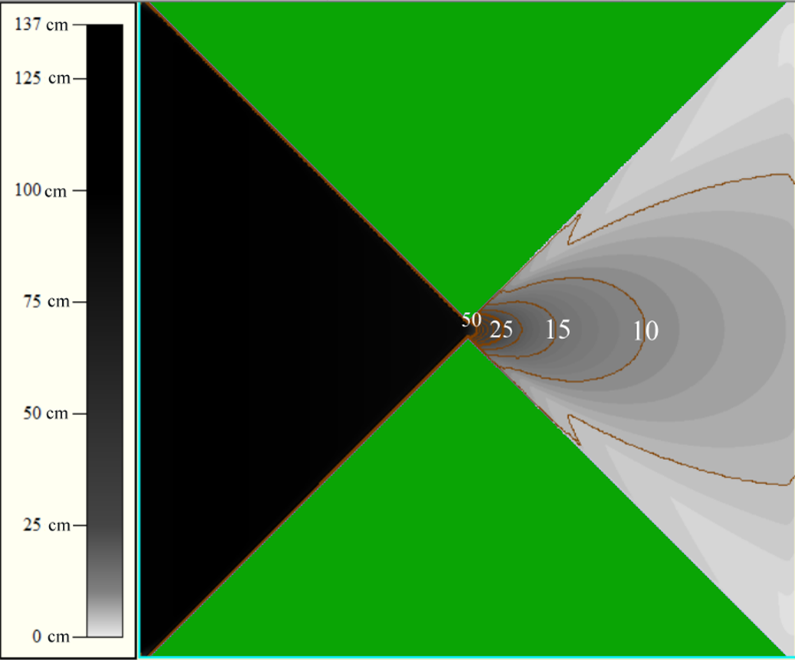
Figure 6: Numerically obtained distribution of the tsunami height maximums. Wave period is 300 sec., strait has 20 km width
Comparing the series of Figures 3-5 with Figures 6-8, when simulating the passage of the wave with the period of 300, 600 and 900 sec through twice as narrow 20 km wide strait, the tsunami heights in the right subarea were expectedly reduced in comparison with the 40 km wide strait. For example, in case of the 40-km wide strait, the height of the wave with the period of 600 seconds in the center of the right boundary of the computational domain equals to 16 cm (Figure 4), while for the 20-km wide strait the height of the initial wave in the same point of the right boundary wave height is detected at 8.5 cm (Figure 7). That is, the height of the wave is almost half as much in the case of a narrower strait. However, when the wave period was increased to 900 sec, this difference decreased and was 17 cm versus 14 cm (Figures 5 and 8).
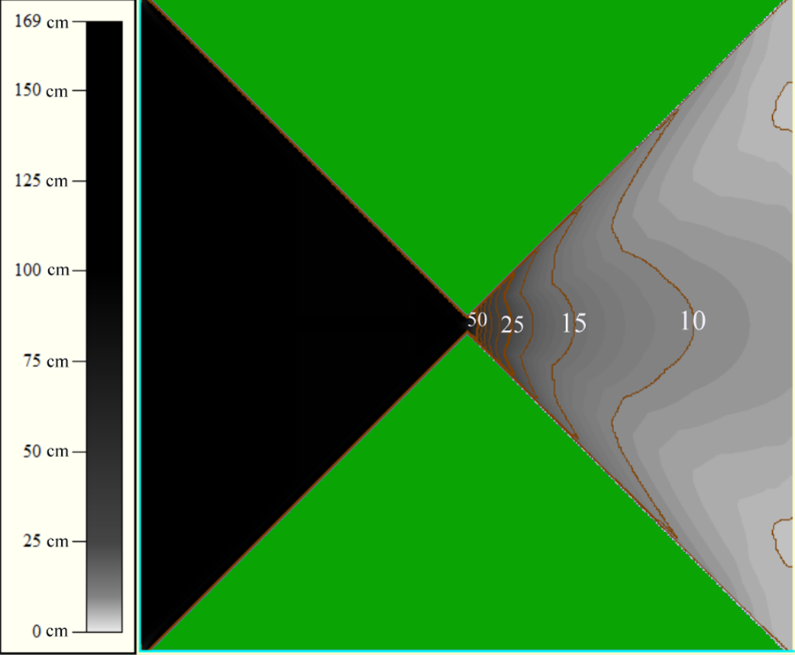
Figure 7: Numerically obtained distribution of the tsunami height maximums. Wave period is 600 sec., strait has 20 km width
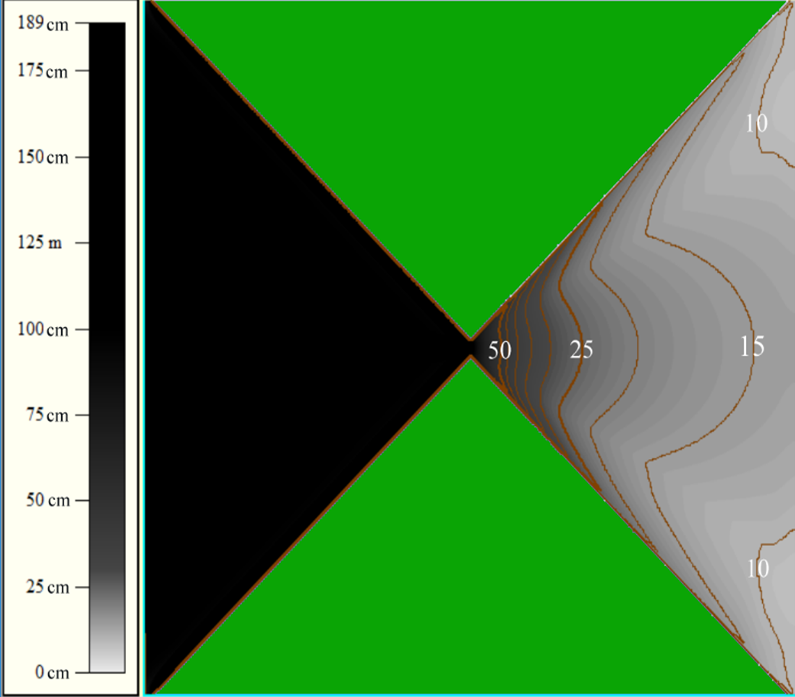
Figure 8: Numerically obtained distribution of the tsunami height maximums. Wave period is 900 sec., strait has 20 km width
3. Numerical Results
3.1. Computational Domain
To investigate the tsunami wave propagation through the straits around Shikoku Island using JODC [10] bathymetric data, a grid bathymetry was prepared, covering the area around the Nankai Trough and Seto Inland Sea from 131° to 140° East Longitude and from 30° up to 35° North Latitude. The depth value array is 3,000 × 2,496 nodes. The spatial grid step in the longitude direction was 0.003 arc degree (282 m), and in the South-North direction the grid step was chosen to be 0.002 arc degree (223 m). Visualization of the computational domain’s geography and bathymetry is presented in Figure 1.
3.2. The influence of the tsunami wave period on the wave height in the Seto Inland Sea
Several numerical tests were conducted to simulate tsunami wave propagation through the narrow strait using real bathymetry. Geographic area around the Shikoku Island (Southward of Japan) was considered. Visualization of this computational domain is given in Figure 1.
The tsunami wave entering through the Bungo Channel and Kii Channel into the Seto Inland Sea was generated using the same boundary conditions (2) on the lower boundary of the computational domain as in the calculations of the wave passing through the straits with the model configuration (cf. Figure 3). Values of flow velocity components must be swapped in the formulae (2).
Similar to numerical tests at the bathymetry model, tsunami waves having periods of 300, 600 and 900 seconds were considered. Initial wave height was 1 m. Numerically obtained tsunami heights maximums around Shikoku Island in case of 600 sec. period wave are shown in Figure 9. The wave was initiated at the lower boundary.
Figure 9. Location and numbering of straits around Shikoku Island. Tsunami wave maxima all around computational area resulted by tsunami modeling of 600 sec. period wave are visualized according to the color legend in the left side of figure
To show the existing narrow straits around Shikoku Island in the considered water area, the white numbers in Figure 9 are used. So, the Bungo Chanel is marked with the number 0. According to numerical experiments, the Kii Channel (having number 2 in Figure 9) has practically no impact on tsunami wave amplitude because it is wide enough. However, the “bottle neck” of the Bungo Channel (indicated by number 1) significantly reduces tsunami height. Numerical results for subareas outlined by pink rectangles (Figure 9) in more detail will be shown later. They contain the straits 1,3,4 and 5.
A series of computational experiments with another tsunami period were carried out in order to study the wavelength influence on the tsunami protection ability of the straits. The influence of the Bungo Chanel on tsunami amplitude is presented in Figure 10 for the 300 sec. period wave.
Numerical results with the same wave period of 300 sec. in the area to the east of Shikoku Island are given in Figure 11. This area, bounded by the pink rectangle in Figure 9, contains the straits number 3-5.
Results of numerical simulation presented in Figures 10 and 11 show high influence of the narrow straits in the Seto Inland Sea on the maximal heights of a tsunami wave. So, the strait 3 (see Figure 9) reduces the wave amplitude by 10 times, while the Straits 1 and 4 – by nearly 4 times. After passing the strait, the wave amplitude is going down because of diffraction and refraction. As a result, the incoming wave of 1 m amplitude becomes almost negligible (with the height of 1-2 cm) to the north of Shikoku Island behind the straits, which is shown in Figures 10 and 11.
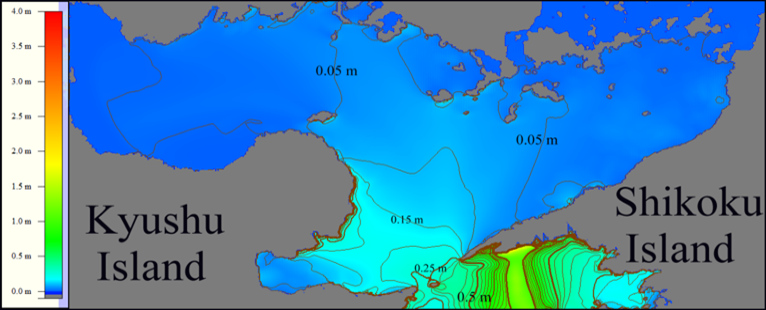
Figure 10: The maximum tsunami heights distribution of the wave having 300 sec period when it passes the Bungo Channel which is indicated by number 1 in Figure 9. Isolines of tsunami height maxima are drawn with an interval of 5 cm
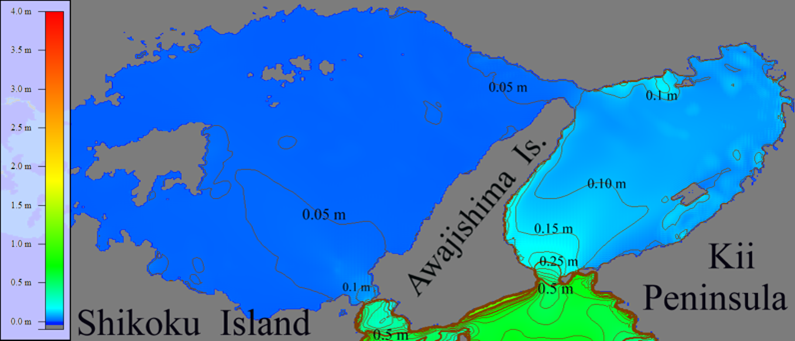
Figure 11: The maximum tsunami heights distribution of the wave having 300 sec period when it passes wide Kii Channel (indicated by number 2 in Figure 9) and narrow straits 3,4 and 5 in the eastern part of Seto Inland Sea
To analyze the dependence of tsunami wave amplitude reduction on the wave period, additional numerical experiments for the Bungo Channel were conducted. The obtained results for the wave periods of 600 and 900 sec. are given in Figures 12 and 13.
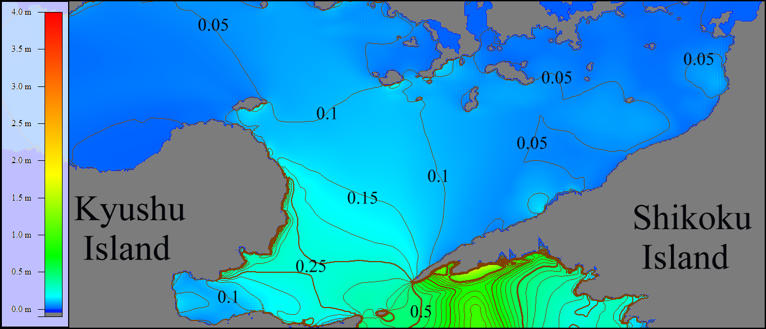
Figure 12: Distribution of tsunami height maxima after the wave having period of 600 sec passed through Bungo Channel. Isolines are drawn with an interval of 5 cm
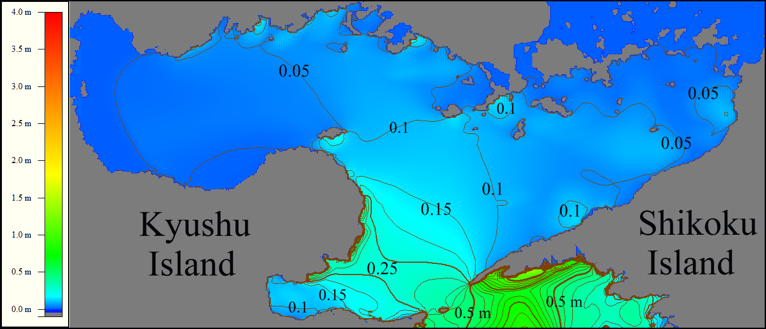
Figure 13: Distribution of tsunami height maxima after the wave having period of 900 sec passed through Bungo Channel
The result of the analysis of the tsunami wave behavior at real bathymetry, shown in Figures 10, 12, 13, is similar to that of the model of numerical experiments, given in Figures 3-8. Namely, the longer is the incoming wave, the larger is the tsunami wave amplitude in the inland sea after the Bungu Channel. The same phenomena are observed for the strait to the right of Shikoku Island studying wave periods of 300, 600 and 900 seconds. Visual results are given in Figures 11, 14 and 15.
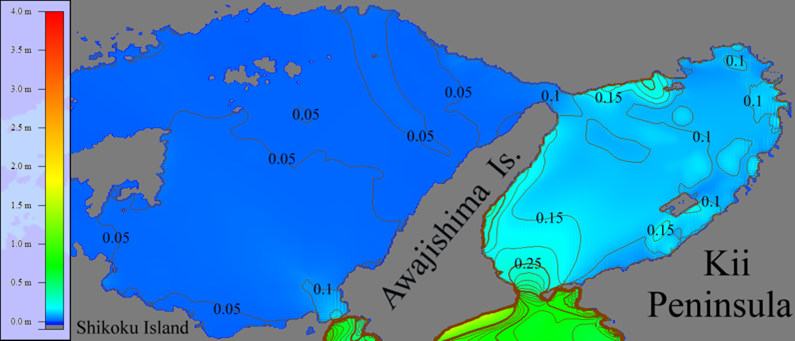
Figure 14: The wave height maxima distribution around Awajishima Island calculated in the course of numerical modeling of tsunami having period 600 sec
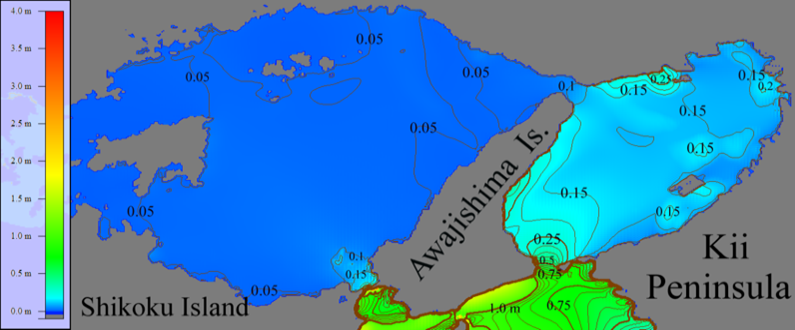
Figure 15: Isolines of the wave height maxima distribution around Awajishima Island calculated in the course of numerical modeling of tsunami having period 900 sec
Considering in detail the water area with the straits number 3, 4 and 5 (Figure 9) one concludes that the rather narrow channels provide better protection against tsunami waves. Indeed, the tsunami height decreases by about three times passing the strait number 4, and by about eight times passing through the strait number 3, Figures 11-15. The inner sea itself, being characterized by a comparatively low depth, reduces tsunami wave amplitude due to diffraction and refraction.
4. Discussion
Numerical calculations for model strait configurations and real straits in the southern part of Japan around Shikoku Island revealed certain patterns of tsunami wave passage through narrow straits. It was found that after passing the narrowest point of the strait, the wave height decreases rapidly in the widening water areas behind the strait due to wave refraction and diffraction. As a result, already in the center of the area, separated from the ocean by the narrow strait, the tsunami height is at an order of magnitude lower than before the wave enters the strait. It is clear from Figures 10-15 that with tsunami heights in front of the narrow straits of the order of 0.5 m to 1 m, the wave heights in the Seto Inland Sea on average are limited by 10 – 15 cm. When the length (period) of the generated wave increases, the maximum heights in the inland waters slightly increase. According to the results of this study, the authors conclude that the population and infrastructure of the Seto Inland Sea coast are sufficiently protected from the impacts of tsunamis generated in the Nankai Trough region. Only in the event of a catastrophic scale with tsunami heights at the entrance to the Straits exceeding 10 m, the population of the coasts of inland waters around Shikoku Island may be severally affected by tsunamis.
5. Conclusion
As a result of a series of numerical calculations of the passage of the tsunami wave with various period through the straits of model configuration, the degree of amplitude reduction after the wave passed the narrowest part of the strait was found. In the same series of numerical experiments, the dependence of the height distribution behind the strait on its width in its narrowest place was studied. The upper limits of tsunami heights in different parts of Seto Inland Sea water area depend on length (period) of the wave coming from Pacific Ocean through the straits around Shikoku Island. The longer the wave period, the higher its amplitude inside this water area. Since narrow straits naturally significantly reduce the height of waves passing through them, tsunamis with a height of more than 1 m can be observed inside Seto Inland Sea only in case of catastrophic events with an extremely large source. Further research on this issue will include model calculations of tsunami behavior in alternative configurations of the straits. Computational experiments simulating the passage of tsunamis through real straits in other places of the Pacific coast will be conducted as well.
Conflict of Interest
The authors declare no conflict of interest.
Acknowledgement
This research was carried out under state contract with IAE SB RAS (121041800012-8) and with ICMMG SB RAS (0315-2019-0004).
- M. Lavrentiev, An. Marchuk, K. Oblaukhov, M. Shadrin, “The wavelength influence on tsunami height in Seto Inland Sea,” in Global Oceans 2021: San Diego – Porto, In Person & Virtual: September 20-23, 2021, Town and County San Diego, doi: 10.23919/OCEANS44145.2021.9705819.
- M. Hyodo, T. Hori, K. Ando, and T. Baba, “The possibility of deeper or shallower extent of the source area of Nankai Trough earthquakes based on the 1707 Hoei tsunami heights along the Pacific and Seto Inland Sea coasts, southwest Japan”, Earth, Planets and Space, 66(123), 2014, http://www.earth-planets-space.com/content/66/1/123.
- J.J. Stoker, Water Waves. The Mathematical Theory with Applications, Interscience publishers: New York, NY, USA, 1957.
- E. Gica, M. Spillane, V. Titov, C. Chamberlin, J. Newman, “Development of the forecast propagation database for NOAA’s short-term inundation forecast for tsunamis (SIFT),” NOAA Technical Memorandum, 2008. URL: https://nctr.pmel.noaa.gov/Pdf/brochures/sift_Brochure.pdf (accessed on 19 December 2021).
- Z. Kowalik, T.S. Murty, Numerical modeling of ocean dynamics, World Scientific, 1993.
- V.V. Titov, F.I. Gonzalez, “Implementation and testing of the method of splitting tsunami (MOST) model”, NOAA Technical Memorandum ERL PMEL-112, USA, 1977.
- R.W. MacCormack, A.J. Paullay, “Computational Efficiency Achieved by Time Splitting of Finite–Difference Operators,” in 10th Aerospace Sciences Meeting, San Diego, CA, USA, 17–19 January 1972; AIAA Paper; pp. 72–154.
- M.M. Lavrentiev, A.A. Romanenko, K.K. Oblaukhov, An.G. Marchuk, K.F. Lysakov, M.Yu. Shadrin, “FPGA Based Solution for Fast Tsunami Wave Propagation Modeling,” in 27th (2017) Int Ocean/Polar Eng Conf, San Francisco, CA, USA, June 25-30, 2017, 924-29.
- K. Hayashi, A. Marchuk, A. Vazhenin, “Generating Boundary Conditions for the Calculation of Tsunami Propagation on Nested Grids,” Numer. Analys. Appl. 11, 256–267, 2018, https://doi.org/10.1134/S1995423918030060.
- J-DOSS|JODC [Electronic resource]. Available online: URL https://jdoss1.jodc.go.jp/vpage/depth500_file.html (accessed 18.07.2022).