IoT System and Deep Learning Model to Predict Cardiovascular Disease Based on ECG Signal
 , Hedia Bellali 5, Ahmed Zouinkhi 1, Mustapha Najjari 6
Adv. Sci. Technol. Eng. Syst. J. 8(6), 08–18 (2023);
 DOI: 10.25046/aj080602
In this work, our contribution will intervene to reduce the impact of noises on the ECG signals. Various ECG denoising approaches were tested to see how efficient they were in removing dominant noises that add to pure ECG signals. Due to different causes such as interference, muscular noise, body movement related to breathing, and so on, the original signal acquired by the electrodes produces noises. In this article, the electrode signals are monitored using an Internet of Things system that combines an Arduino board and an AD8232 module to generate a one-dimensional signal. These ECG signals are displayed on a computer using the Matlab interface. Following that, an efficient deep learning model was developed to facilitate cardiologists in their diagnosis of ECG signals. These experimental results obtained demonstrate the effectiveness of our proposed model compared to other existing methods in the literature. Finally, the filtered and classified ECG signals are given to the doctor for correct treatment of the patient’s condition.
1. Introduction
An ECG is a signal that shows how the heart’s electrical system is working. The relaxation (repolarization) and contraction (depolarization) of the heart’s ventricular and atrial muscles produce an ECG signal [1]. A P wave (due to atrial depolarization), a QRS complex wave (due to atrial repolarization and ventricular depolarization), and a T wave (due to ventricular depolarization) make up the ECG signal. Transducers (electrodes) are placed in certain locations on the human body to mark the ECG signal. Noises (artifacts) are undesired signals that mix with the ECG signal and may prevent doctors from making a correct diagnosis. As a result, proper signal processing procedures must be used to eliminate them from ECG signals [2]. Powerline interference, baseline wander, EMG noise, and electrode motion artifacts are the four main forms of artifacts seen in ECG signals. They are discussed briefly below.
The electrical activity of the heart is represented by an electrocardiogram signal. ECG is an essential component for monitoring cardiovascular disease patients [1]. The theoretical and practical bases for recording cardiac electrical activity were laid out by Einthoven in 1901 and, although the postulates proposed are highly debatable, are still used in electrocardiography [2]. In the following paragraphs, we briefly describe the inactivity of the heart, the modes of recording this electrical activity, and the main frequency characteristics presented by the ECG.
The electrocardiogram (ECG) facilitates the diagnosis of many heart (or extra cardiac) diseases in association with clinical, laboratory or echocardiographic data. The analysis of an ECG must be methodical and rigorous. The criteria for a normal ECG and the variants of normal should be well known. Abnormalities in rhythm, conduction, chronic or acute pathologies that can also be detected [3].
You must first inquire about the clinical situation / symptoms motivating the performance of the ECG, age, sex and sometimes ethnicity, examination conditions (half-seated, lying down, etc.), the morphology of the rib cage, pathologies or taking medication(s) with possible repercussions on the heart and the existence of a pacemaker. All of this information is useful but can sometimes bias the interpretation (” expectation bias”).
One of the main steps in the data acquisition operation is filtering. The latter is a relative operation, that is to say to apply it, we must determine what is filtered (determine useful signals and parasitic or disturbing signals). For example, if our system is radar tracking an airplane, the useful signal will be the position of this airplane and any other signal will be considered as an interruption; in our case, the useful signal is the electrocardiogram signal, and the parasitic signals will be all other signals circulating in the human body (EMG, EEG, and others.). Therefore, we can say that the main function of a filter is to minimize the effect of disturbances and provide a smoother useful signal.
Demand for accurate and portable ECG monitoring has increased. Only a few hospitals in semi-developed countries own instruments that measure electrocardiographic (ECG) or cardiovascular activity. Despite the compact size of these portable devices, precision filtering, high-performance processing power, and integrated high-resolution graphics control distinct from the main microcontroller core are still required [4]. The necessity for physical capacity has become important as medical observation of patients becomes more remote. The Microchip Connected Body and Body ECG Demonstration Board may be used to create advanced fitness monitoring devices, as well as remote patient monitoring and diagnostic systems.
The essential goal of this article is to collect or get data on the electrical activity of the patient’s heart and, following a well-studied optimal filtering, to use telecommunication equipment to send this ECG signal to the doctor. We are talking about an act of telemedicine called tele-surveillance or remote monitoring. In the first section of this work, we describe a generality on ECG signals as well as the difficulties of monitoring these signals. The second section of this work focuses on our contribution to monitoring ECG signals via IoT system as well as the interpretation of real measurement results performed on three patients. In the last section of the work, we describe the different types of noises that can generate ECG signals as well as the different digital techniques to remove them before sending them to the doctor for good medical treatment.
The rest of this paper is organized as follows: related works are investigated in section 2. Material and methods are presented in detail in section 3. In Section 4, we described implementation and testbed, followed by the experimental results in sections 5. Finally, the paper concludes.
2. Related Work
The value chain research and analysis of the ECG monitoring system helps to understand the useful contribution of each operation in the device, the best practices that each process can adopt, and the overall purpose of the system to assure improved disease diagnosis. The information collection, feature extraction, pretreatment, analysis, processing, and visualization operations are all part of the ECG surveillance importance chain. The majority of published studies support the above-mentioned primary ECG monitoring approach. Some studies have defined additional different or overlapping methods such as information cleansing, encryption, and compression, depending on the type of control application, however they may be included as part of the approach.
Various signal treatment approaches for removing artifacts from ECG data are presented in this section. The classification of ECG signal denoising techniques in the literature is shown in Figure 1. This part also includes the results of the methodologies discussed.
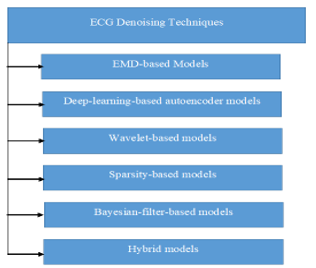
Figure 1: Techniques of ECG signal denoising techniques.
In [5], an adaptive iterative algorithm that breaks the signal down into a series of oscillation segments, called an Intrinsic Mode Function (IMF) was studied. This is an EMD (Empirical Mode Decomposition). With this iterative decomposition of the signal, EMD will be able to divide the whole signal into ordered elements whose frequency varies from the highest to the lowest of each IMF level.
In [6], the authors claim that the local time characteristics of the signal are the bases for the decomposition of the EMD process, so it is suitable for nonlinear and nonstationary processes.
In [7], an EMD based on a completely information-driven instrument was developed, which does not require an outset known basis and differs from data analysis techniques such as the Fourier transform.
In [8], Vincent et al. discuss denoising methods based on auto-encoders. This type of ECG denoising, the deep learning-based model, is built on the basis of the function of the denoising auto-encoder (DAE). This is the first step in unsupervised learning, mapping the input to the intermediate representation. To regenerate an input signal as accurately as possible, the automatic learning model that can be used is that of the auto-encoder. It is a combination between two non-linear sub-parts, namely the encoder and the decoder.
In [9], a novel set of approaches for removing noise from ECG signals is discussed. The signal is extended as a function of frequency and time using the wavelet transforms (WT). WT can provide good temporal and frequency resolution in HF and LF, respectively. As a result, using WT to analyze ECG data is quite effective. The signal can be decom-posed into a collection of fundamental functions using this method, including ctraction, translation of the mother function x (mother wavelet), and expansion. The usage of Dyadic WT (DWT) for evaluating ECG data is particularly favorable due to its calculation speed and multi-resolution properties [10].
A sparse decomposition was used in [11] to reduce noise in the ECG signal. The signal is divided down into components, with each component being separated into scattered residues and parts. As a result, these empty regions are employed to estimate proper signals because they hold the useful information in the signals. The shares are deconstructed using a nonlinear optimization approach to find the sparsest illustration.
The authors of [12] describe a more advanced version of the standard Kalman (KF) filter. To decouple ECG signals, many model-based approaches have been developed. Model-based techniques are founded on the idea of estimating an essential model’s hid-den states. The latter is noticed using a series of measurements, one of which is the Kal-man filter (KF). Although this simple filter uses a linear model of system dynamics and surveillance equations, most systems are not linear. EKF, EKS (Extended Kalman Smoother), and UKF are three different editions of the original KF (Unscented Kalman Filter).
The researchers combined several denoising techniques to diagnose ECG signals in order to improve the performance of essential dancing procedures, i.e. they attempted to combine procedures from various fields to denoise the ECG signals in order to achieve top results in the standard. We will explore successful hybrid ways to denoising the ECG signal in this section of the study.
The authors of [13] attempted to combine the EMD process with the concept of an adaptive transition thought filter (ASMF). In the same method, the advantages of both strategies are combined to reduce ECG signal noise. Classical EMD rejects attempts to re-duce HF sounds using a window-based approach or initial IMFs, but for HF noise reduction, an ASMF operation is used to track a wavelet-based soft thresholding strategy.
In [14] authors proposes and investigates a new ECG denoising approach based on a combination of vibrational mode decomposition (VMD), NLM (Non-local Means) assessment, and discrete WT filtering method (DWT).
FFT was used in combination with an adaptive R peak identification method to de-noise and detect ECG signals in [15].
In [16], the EMD algorithm was combined with Savitzky–Golay (SG) filtering and Riegmann-Liouvelle (RL) fractional integral filtering to create a novel ECG denoising approaches.
ECG denoising was done with a wavelet neural network in [17], which approximated the signal with the maximum precision achievable. The backpropagation neural network was created with two hidden layers and ten neurons using conjugate gradient optimization. Parent wavelets from libraries such as Daubachies, Symlet, and others are used as hidden layer triggering functions for ECG signal estimation. An investigation of DWT-NN for denoising ECG data was provided in [18]. The authors of this research present a technique with high efficiency for real-time hardware and the best accuracy (96%) for ECG denoising only.
The authors of [19] propose a hybrid technique in which EMD enhanced output is delivered to a DWT-based denoiser in addition to EMD enhanced output. The most recent versions combine an adaptive flexible threshold with a generic threshold that is changed based on signal strength.
For noise suppression, the NLM and EMD models are mixed in [20]. A four-step technique has been presented, including landmark detection (R peak detection), differential standard deviation computation, NLM framework, and EMD framework. Table 1 summarizes the many works provided.
Table 1: Comparative analysis with main recent research studies.
| Ref | ECG Dataset | Efficiency for Real-Time Hardware | Performance | |
| [5] | MIT-BIH Arrhythmia Database | Medium | 93%-96% Sensitivity and Positive Predictivity | |
| [6] | MIT-BIH Arrhythmia Database | High | 94.1% Accuracy | |
| [7] | MIT-BIH Arrhythmia Database | High | 94.7% Accuracy | |
| [8] | MIT-BIH Arrhythmia Database | High | N/A
Time complexity most efficiency |
|
| [9] | MIT-BIH Arrhythmia Database | High | 96.1% Accuracy | |
| [10] | MIT-BIH Arrhythmia Database | High | 92%-94% Sensitivity and Positive Predictivity | |
| [11] | MIT-BIH Normal Sinus Rhythm Database | High | 94%-96% Sensitivity and Positive Predictivity | |
| [12] | MIT-BIH Normal Sinus Rhythm Database | High | 95.3% Accuracy
|
|
| [13] | MIT-BIH Normal Sinus Rhythm Database | Medium | N/A
Time complexity most efficiency |
|
| [14] | MIT-BIH Normal Sinus Rhythm Database | Medium | N/A
Time complexity most efficiency |
|
| [15] | MIT-BIH Normal Sinus Rhythm Database | Medium | 94.3% Accuracy | |
| [16] | MIT-BIH Noise Stress Test Database |
|
High | 96.8% Accuracy for ECG Denoising only |
| [17] | MIT-BIH Noise Stress Test Database | High | 95.6% Accuracy for ECG Denoising only | |
| [18] | MIT-BIH Noise Stress Test Database |
|
High | 96% Accuracy for ECG Denoising only |
| [19] | MIT-BIH Noise Stress Test Database |
|
High | N/A
Time complexity most efficiency |
| [20] | MIT-BIH Noise Stress Test Database | Medium | 97.9% Accuracy for ECG Denoising only |
Generation and monitoring of ECG signals will be studied in sections III and IV respectively.
3. ECG Signal Generation
The ECG can be analyzed by examining the waveform component. These global components indicate the body of the active electrical board. The first rising line of the ECG path is the P wave. It shows atrial contraction. The activation wave allows the repolarization and depolarization of cardiac cells which can be received by electrodes located in certain places [21]. These methods result in the global waveform called normal ECG, as shown in figure 2.
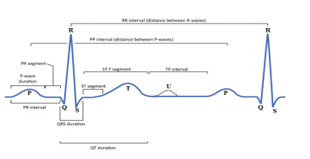
Figure 2. ECG Signal.
You must read the entire ECG trace like a book, from top to bottom then from left to start with the frontal leads then the precordial leads and end right, that is to say with the long trace of one or more leads (generally 10 seconds provided at the bottom of the page by the manufacturers). Each deflection described by Einthoven must be analyzed.
The following are the waveforms that make up the ECG: a P wave is a deviation response to the depolarization of the right and left atria, whereas a T wave, which is usually less ascending, represents the QRS complex, which starts with Q and ventricular repolarization, small downward deviation, and then more upward deviation, a peak(R), and then a falling S wave. This QRS complex show off ventricular and depolarization contraction. The QRS complex is the same to a series of decreases because of the depolarization of the ventricles. Normal values for declination times are Q-wave ≤ 0, 04 s, P-wave ≤ 0, 11 s, QRS complex at 0,1 s, usually 0. 06 and 0, 08 s and the length of the QT wave varies depending on the heart rate. It gets longer as the rate decreases and down as it increases.
4. ECG Signal Monitoring
Over the past few decades, heart disease has become a big problem as many people die from health problems. Thus, heart disease cannot be relieved. By initially diagnosing or monitoring an ECG, this disease can be prevented. In this study, we are interested in a complete system for monitoring patients at home in real time. We’ll need a sensor to create this system, which will be affixed to the patient’s body. This sensor is part of a WSN network that can be found in a hospital or a house. All patient information is recorded and transmitted to the hospital via a WSN network. To take all necessary corrective measures in an emergency, the hospital transmits the data to the doctor. In the event of a sudden, unassisted relapse with patients, a WSN email address was used to determine the patient’s whereabouts. The Wireless Sensor Network (WSN) is used to monitor the environment or physical phenomena, such as noise, pressure, motion, or temperature, and to transmit data to the destination.
Nowadays, with the explosive growth of IoT technology, more and more practical applications can be found in many fields, including security, smart metering, agriculture, smart cities, and more home intelligence. There are other applications, in particular military, home automation, industrial, sanitary, and above all medical and sanitary. This article proposes and explores home health care [22]. The Arduino can be used to perform a portable ECG with the heart condition reading function. The main component of this system is the AD8232 sensor which can read the heart rate and process the voltage of the electrodes connected to the body. By combining the Arduino and HC 05 FC-114 microprocessor like Bluetooth or Wifi, ZigBee, GSM / GPRS and even XBee, the ECG screen is displayed in real time on a smartphone. We used an ECG simulator as an artificial corrective agent which is used as a tool to justify the performance of a portable ECG based on the results obtained from the test. The EGC can be sent via the simulator to the smartphone or to the Matlab interface via a wireless communication module (ZigBee, Bluetooth, Wifi, GSM / GPRS or XBee) [23]. The precise result depicts the patient’s current state in real time. The ECG results are presented in this paper using the Matlab interface [24].
Currently, with the development of electronic media, especially with the appearance of the Arduino module and thanks to the advantages it presents, the realization of any project has become an easy task (figure 3). In this work, we will use the Arduino module, XBee module and other ways to monitor an ECG signal and its remote emission [25].
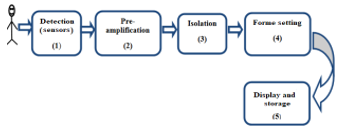
Figure 3. Block diagram of an ECG.
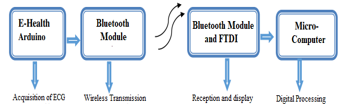
Figure 4. Block diagram of our Remote ECG signal monitoring application.
The first step of our project is to acquire the ECG signal. The electrodes implanted on the patient’s body to explore and transfer the signal to an E-Health 2.0 acquisition card ensure this procedure (figure 4). The latter guarantees the format and processing of the electrode signal. The e-Health acquisition board is then attached to an Arduino board, which converts the ECG signal to analog-to-digital (ADC) format [26]. As a result, using an Xbee transmission module, the resulting digital signal can be sent remotely to another station [27]. At the reception point, another XBee reception module on an FTDI card will allow reception of the transmitted signal [28]. This XBee reception module is connected to a microcomputer to view and process the received signal.
An ECG is a paper or digital recording of the heart’s electrical signals. It is used to determine heart rate and other information about heart disease, such as heart attacks, pacemaker function, and heart failure. The synthesis (or conclusion) is intended to answer the question posed by the clinical situation. For example, we can conclude that:
- Normal or variant ECG: atrial repolarization, early repolarization, wandering pacemaker, etc.
- Nonspecific QRS or repolarization abnormality): microvoltage, intraventricular block, fragmented QRS complexes, ST depression, Chatterjee effect, secondary repolarization disorder …
- Specific anomaly: sinus dysfunction, sinus bradycardia, sinus tachycardia, atrial fibrillation . . .; atrial or ventricular hypertrophy, preexcitation, sequelae of necrosis, amyloidosis. . .; bundle branch block, bifascicular block, AV block. . .; Brugada repolarization, long QT interval …
- ECG in favor of an acute pathology: infarction, coronary ischemia, acute pericarditis, pericardial effusion, pulmonary embolism, hyperkalaemia, hypothermia, intoxication.
In the first phase of this work, we performed a generation of ECG signals with their spectral concentration in MATLAB. A study of ECG signals is performed for three patients whose characteristics are listed in Table 2.
Table 2. Patient Diagnosis.
| Patient | Patient1 | Patient2 | Patient3 |
| Sex | Female | Male | Male |
| Age | 35 | 48 | 81 |
| Diabetic | No | No | Yes |
| Smoking | No | No | No |
Figure 5 shows a complete portable ECG on the patient’s body during a monitoring test as well as data collection and transfer via a Bluetooth module.
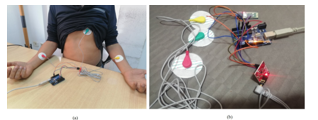
Figure 5. ECG monitoring test and data collection with Bluetooth module.
4.1. Test for acquiring data
The Bluetooth-enabled wearable ECG was then tested on a real human body with heart problems. The results are provided, followed by an explanation based on medical logic and a conclusion. These signals have a 10 second period and a 1000 Hz sample frequency. Each patient conducted 15 tests, each of which is an ECG signal, with the results shown in the figures below. The results of a healthy heart are explained by Figure 6. The two key values obtained from the data were the form of the PQRST wave and the heart’s BPM. An ECG wave was recorded and visualized using a Matlab interface in this example. The P wave, the QRS complex, and the T wave are all clearly split into three components in this ECG wave. A P-type wave is caused by the register of the SA node, which was a heart stimulating node. The QRS complex is formed when the ventricular muscle relaxes and contracts at the same time. A recording is made as the ventricular muscles repolarize to prepare for the next heartbeat; this is the T wave.
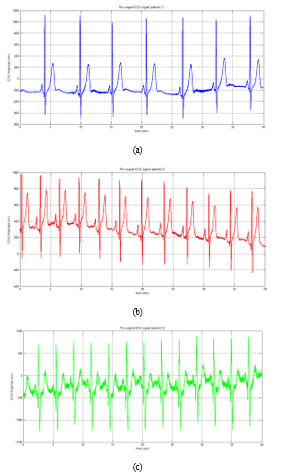
Figure 6: ECG signals for three patients
4.2. Detection of the number of beats
In an ECG signal, the R-wave represents the patient’s heart- beat [29]. We determine the main “R” peaks for each patient’s ECG signal, as well as the typical period of the signal amplitude (figure 7).
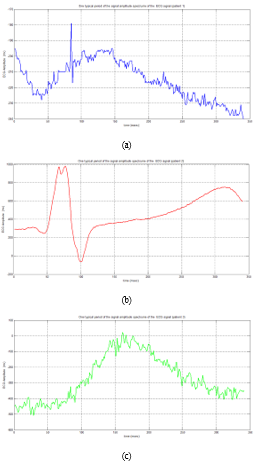
Figure 7: Typical Period Variation of ECG Signal Amplitude for Three Patients
The heart rate is measured in beats per minute (BPM) over a 60-second period. A healthy heart rate is 60-100 beats per minute at rest, but it increases to around 110-150 beats per minute during exercise and 40-60 beats per minute during sleep [30]. When collecting data about a patient’s heart, it’s best to put them to sleep. The patient is affected by bradycardia if the heart rate is below 60 BPM or tachycardia if the rate is beyond 100 BPM for a heart rate externally ranging between 60 to 100 BPM (Table 3).
Table 3. Number of dominant peaks” R”.
| Patient | Patient1 | Patient2 | Patient3 |
| Number of dominant peaks” R” | 8 | 33 | 13 |
| Number of beats (BPM) | 12 | 49 | 20 |
4.3. ECG Signal Spectral Analysis
For each patient, we determined the spectrum of the ECG signal (figure 8), Nyquist frequency (Table 4), and figure 9 depicts the PQRST cycle of three patients’ ECG signals.
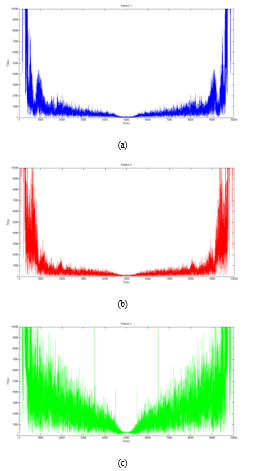
Figure 8: ECG signal spectral of patients
Table 4. Patient Diagnosis.
| Patient | Patient 1 | Patient 2 | Patient 3 |
| Nyquist frequency (Hz) | 2.9511 | 6.5968 | 4.2440 |
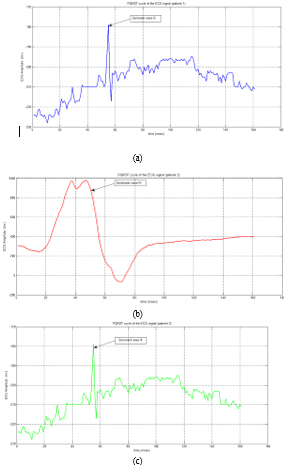
Figure 9: PQRST cycle of the ECG signal
5. ECG Noises
The ECG program contains a variety of noises. Baseline wander, power-line interference, and muscular artefacts are the most common. Body movement, breathing, poor electrode contact, and skin electrode impedance promote baseline wander [31]. The consequences of distortion of the ST segment and LF components of the ECG signal are dependent on electrode and electrolyte characteristics, skin impedance, and body movement, and range between 0.05 and 1Hz. Power-line interference [32], caused by capacitive and inductive couplings of ubiquitous power lines in the ECG signal acquisition circuit, with an amplitude and peak duration of 50% of the ECG signal amplitude, a spectrum with narrowband noise centered at 50/60 Hz with a bandwidth of 1 Hz, and the effect of produced is a distortion of the local low amplitude waveform of the ECG signal, amplitude, and duration. Muscle artefacts [33] are caused by electrical activity in muscles during contractions or when the body moves suddenly, with 10% of the ECG signal amplitude and spectrum at 20-1000 Hz. It has the effect of changing the local waveforms of the ECG signal [34].
5.1. Baseline Wander
The equipotential line of the heart is called the baseline; if the heart has no electrical activity, this is the trace that can be seen on the electrocardiogram [35]. During an ECG examination in the office or during a night Holter recording, this line is generally horizontal because the patient does not move, and the signal is little disturbed by outside noise. On the other hand, during the day, the movement of the patient will modify the relative position of the electrodes, so that this line appears wavy.
5.2. Power line Interference
It is activated at the same time by two myocardial regions which are flowing at the same time. This results, for example, in fusion complexes, aberrations or pseudo-blocks. This phenomenon also explains the aspects of QRS during atrial fibrillation caused by accessory bundles (see Atrial fibrillation / flutter and accessory bundles) [36].
5.3. Muscle artefacts
Motion noises are similar to the characteristics of the baseline drift signal, but because their spectral content significantly overlaps the spectral content of the PQRST complex, it is more difficult to resolve. Stretching of the skin, which affects the impedance of the skin around the electrode, is the most common cause of electrode movement abnormalities. They mostly appear in the 1 to 10 Hz range, and on ECGs, these aberrations appear as greater amplitude waveforms that can be mistaken for QRS complexes. Electrode motion artifacts are a key source of a misperceived heartbeat in Holter surveillance [37].
6. Remove noises from our ECG signals
Filtering the ECG signal is a technique for removing noise around the signal generated by the ECG machine. High frequency noise is caused by extracardiac muscle activity and interference from electronic equipment. Low frequency noise is caused by body movements associated with breathing, physical and chemical changes caused by electrodes placed on the skin, and small changes in blood flow. To reduce these noises (see parasites), the patient should breathe calmly and avoid moving or touching metal. Before placing the electrodes, the skin must be perfectly prepared (shaving, simple washing and rubbing to improve the capillary flow of the peripheral electrodes, do not use alcohol). It is also important to avoid overlapping recording threads (loops). Several types of filters can be used in the event of interference:
- To remove interference from electric current (removal of 50 or 60 Hz depending on the country).
- To remove very low frequency noise, we use a classic high-pass filter which removes in real mode noises below the threshold of 0.05 Hz. A 0.5 Hz, real time high pass filter records / generates ST segment distortions. This threshold can simulate an anteroseptal ST + infarction or a Brugada ECG.
On the other hand, in automatic mode (analog recording then digital signal processing, usual mode of modern ECGs) a digital linear filter is acceptable up to the threshold of 0.67 Hz, because it eliminates the deviations from the baseline).
A conventional low pass filter is used to eliminate high frequency noise, which removes noise over 150 Hz in real mode. A low pass filter calibrated to 75 Hz or less will slightly reduce the amplitude of QRS and the ability to detect small deviations (Q microwave, QRS fragment complex wave, J wave, wave). It further smooths the path and removes many fast artifacts. A low pass filter calibrated to 35 Hz or even 20 Hz can significantly reduce the amplitude of the QRS and reduce the signs of ventricular hypertrophy.
The general recommended bandwidth for adults is between 0.05 Hz and 150 Hz (250 Hz for children). But most devices on the market offer preset filters between 0.5 and 40-50 Hz, because the design is more stable and the noise is less, which makes basic users more satisfied. This is a compromise generally adopted by users who are new to the more refined ECG … and accept the risk of false positives / negatives, although rare this can be caused by improper filters. It is best to decide whether to enable low pass and / or high pass filters before printing depending on the quality of the drawing.
After applying filtering steps to each patient’s ECG signals, we transfer those signals to the right doctors and physicians to make the right decisions about the patient’s health (figure 10 and figure 11).
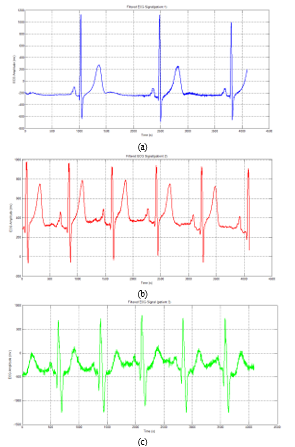
Figure 10: Filtered ECG Signal
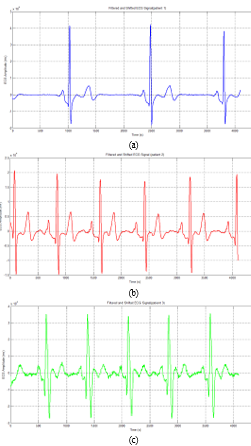
Figure 11: Filtered and Shifted ECG Signal
To develop our IoT system for monitoring ECG signals, we have opted to use artificial intelligence, so we will offer an application of IoT and embedded AI for detection, monitoring of ECGs and learning for the detection of noises which generate these signals.
7. The effect of filtering on ECG data classification for cardiovascular disease using a deep learning model
Deep Learning-based classification methods for detecting cardiovascular disease ECG features are gradually gaining attention. In this section, we will discuss the importance of ECG signal filtering in detecting cardiovascular disease. The main contribution of this comparison is to highlight the importance of signal filtering in improving cardiovascular disease.
Deep learning requires a large database to effectively train the model; thus, we decide to train our model with the PTB-XL database [38], which comprises 21 837 recordings. PTB XL is a dataset containing 23 classes; the ratio of each database is presented in Figure 12.
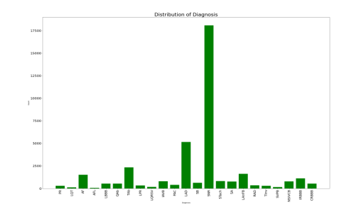
Figure 12. Data Distribution.
7.1. Data preprocessing
Classification researchers usually passed preprocessing of the data and feature extraction of the signal to train and evaluate the model correctly [39]. Data preprocessing is the process of preparing data for training by removing noise and filtering signals. Many researchers employed different noise removal approaches, such as wavelet transform-based algorithms [40] and adaptive digital filters [41].
In this paper, we propose to compare two methods one that does not filter ECG data and method 2, which is based on filtering, wavelet transform method was used to enhance the ECG signal. The wavelet transform technique decomposes nonstationary data into scale signals with various frequency bands [42].
This study has selected 23 ECG recordings for classification with length varies from signal to other, since the deep learning model requires a normalized dataset, in our study, the signal length has been segmented to 5000 samples (10 seconds).
The use of embedded AI can be very useful for detecting ECG signals. For this, it is possible to design a learning model based on a convolutional neural network (CNN) for the detection of ECG signals. This model is trained on an image database, which is then processed and tested to improve detection performance. Experiment results reveal that our model outperforms other common object classifiers. The major improvements enable the model to work effectively in real ECG applications. In the second step, we applied this learning model on a database of ECG signals, these real signals were measured and monitored by our IoT monitoring system proposed and studied in the first section of this work.
7.2. Model training
For the training step, the two methods have been trained using Inception model figure 13, which is a variant of CNN, to classify 23 cardiovascular diseases. To extract the deep features, five Inception blocks, concatenated with max polling (MaxPool), are used, each block contains six convolutional layers (Conv1d), five batch normalization layers (BatchNorm1d), six rectified linear unit (ReLU) activation layers, and max polling (MaxPool). Figure 13 illustrates an overview of the model architecture.
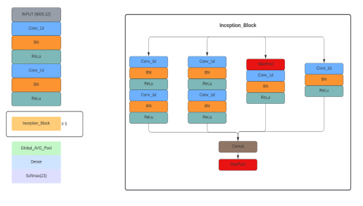
Figure 13. Model architecture.
The dataset used was split into two sets: training & validation set contains recordings and test set contains 19653 & 2184 recordings respectively, using cross-validation the dataset was randomly divided into 10 folds. In each round 9 out of 10 folders have been utilized for training, while one folder is used for validation, 5 epochs are created per each training fold, in total 50 epochs.
To train the model, the Adam optimizer has been used as the optimization method and binary cross-entropy as the loss function.
7.3. Results and discussion
This paper presented a model based on convolutional neural networks, optimized to limit the complexity of ECG detection and classification of cardiovascular diseases. Our proposed technique was implemented in Python 3.7 utilizing the Keras framework with a Tensorflow backend.
The accuracy acquired throughout the training and validation phases is 96.72% and 96.45%, respectively in filtering method and 96,23% and 96,20% for no filtering method. For loss, each phase reached 0.0227 and 0.1070 for no filtering and 0.0849 and 0.0866 for filtering method. The data split is the usage of ten stratified folds that leads the model grow disorderly from the fold to fold until it stabilizes in the final fold. We can note that there is a disorder in value from one epoch to another caused by the usage of ten stratified folds, since each fold contains 5 epochs the disorder is clear after every 5 epochs. The results are relatively close in both methods accuracy of 96,72 % and loss of 0.0227 without filtering, 96,23 % in term of accuracy and loss of 0.0849 with filtering. The relevance of filtering is that the model’s results with filtering are more stable than without filtering.
The Metrics results of model proposed in each method are illustrated in Figures 14 and 15.
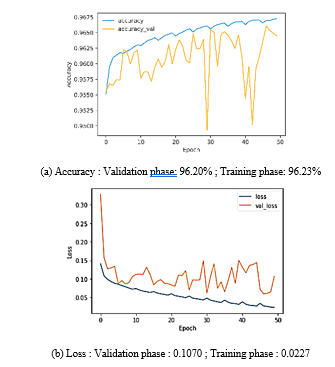
Figure 14. Method 1: without filtring.
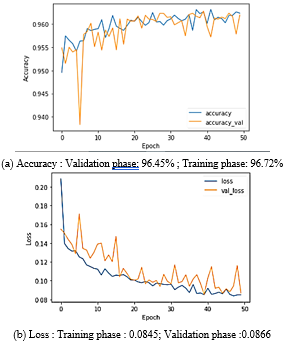
Figure 15. Method 2: with filtring.
A deep convolution neural network (DCNN) to classify 5 types of ECG, and their approach achieves an accuracy of 93.19%. In [43] authors proposed an 11 layers CNN to detect 2 types of heartbeats, they achieve an accuracy of 95.22 %, meanwhile in [44] authors succeed to achieve 97.2% in term of accuracy to detect five cardiovascular diseases using a CNN network. Comparing to resultants achieved in the literature, our results for classifying 23 cardiovascular diseases are significant and acceptable.
Table 5 compares the accuracy and loss of our research to the literature studies.
Table 5. Comparison of different literature studies.
| Author, year | Preprocssing | ECG classes | Classifier used | Results |
| Atal et al, 2020 | Gabor filter and wavelet transform | 5 classes | DCNN | Acc: 93.19% |
| Acharaya et al, 20 | Denoising | 2 classes | CNN | Acc: 95.22% |
| Wu et al, 2021 | wavelet transform method | 1 classe | CNN | Acc: 97.2% |
| Proposed approach, 2022 | wavelet transform
method |
23 classes | Inception | Acc: 96.72% |
The disorder in second method, after filtering the signals, is more stable than in the first method. As a result, we may conclude that filtering is critical for model stability, even if the gap between the validation and training phases is tiny enough to ensure that our model learns effectively.
It is more crucial to raise the metrics of the classification model for disease diagnosis because the correct detection of a cardiovascular disease is more significant than a misdiagnosis our future work will be based on model improvements to obtain important results.
8. Conclusions
The use of ECG monitoring equipment has been extensively studied in the literature. We have provided an in-depth overview of the literature related to ECG monitoring systems in this article, focusing on a variety of factors such as application, technologies used, architecture, life cycle, categorization, and defiance. The Internet of Things (IoT) delivers remote, infinite connection and services that harness data and enable fast, relevant and vital lifestyle decisions. We proposed a new compact IoT system for remotely monitoring ECG signals in patients. The data are shown via the Matlab interface after converting the data gathered by the electrodes and the AD8232 sensor built into the Arduino board into a “csv” or “.m” extension file. Following that, we used various digital filtering methods to remove any noise that could have caused these ECG readings. To that purpose, we support this work, as well as a detailed assessment of other related research projects that provide a comprehensive overview of the state of the art in ECG monitoring systems. It can serve as a resource for various researchers and field participants to compare, assess, and evaluate the functionality of ECG monitoring systems. It also highlights the main defiance that occurs with these systems. We also developed a deep learning model based on a convolution neural network to evaluate the results of metrics (accuracy and loss) with and without filtering, and we were able to attain an important and acceptable accuracy when compared to results achieved in the literature. We attain an accuracy of 96.23% with filtering and 96.72% without, they are relatively close but filtering with wavelet transform makes our model more stable. Finally, it discusses how next-generation ECG monitoring devices for healthcare will be perceived in the future.
Conflict of Interest
The authors declare no conflict of interest.
Acknowledgment
This research was funded by the Deanship of Scientific Research at EITA Consulting, Montesson, France.
- Balestrieri, L. De Vito, F. Picariello, I. Tudosa, “A novel method for compressed sensing-based sampling of ECG signals in medical-IoT era,” Proc. of the IEEE Int. Symp. on Medical Meas. and Applications (MeMeA), Istanbul, Turkey, 1-6, 2019, DOI:10.1109/MeMeA.2019.8802184.
- Kamble, A. Birajdar, “IoT based portable ECG monitoring device for smart healthcare,” Proc. of the 5th International Conference on Science Technology Engineering and Mathematics (ICONSTEM), Chennai, India, 471-474, 2019, DOI: 10.1109/ICONSTEM.2019.8918776.
- Gupta, A.K., Chakraborty, C., Gupta, B, “Monitoring of epileptical patients using cloud-enabled health-IoT system,” Traitement du Signal, 36(5), 425-431, 2019, DOI: https://doi.org/10.18280/ts.360507.
- Span, S. Di Pascoli and G. Iannaccone, “Low-Power Wearable ECG Monitoring System for Multiple- Patient Remote Monitoring,” in IEEE Sensors Journal, July 1, 2016, DOI:10.1109/JSEN.2016.2564995.
- Chang, K.M., “Arrhythmia ECG noise reduction by ensemble empirical mode decomposition,” Sensors, 10(6), 6063–6080, 2010, doi: 3390/s100606063.
- Munirathinam, R., Ponnan, S., Chakraborty, C, “Improved performance on seizure detection in an automated electroencephalogram signal under evolution by extracting entropy feature,” Multimed Tools Appl, 2021, https://doi.org/10.1007/s11042-021-11069-7.
- Blanco-Velasco, M., Weng, B., Barner, K.E., “ECG signal denoising and baseline wander correction based on the empirical mode decomposition,” Comput. Biol. Med., 38 (1), 1–13, 2008, DOI: 1016/j.compbiomed.2007.06.003.
- Ehnesh, M., Abatis, P. &Schlindwein, F.S, “A portable electrocardiogram for real-time monitoring of cardiac signals,” SN Appl. Sci, 2(8), 1419,2020, DOI:1007/s42452-020-3065-9
- Akansu, A.N., Haddad, P.A., Haddad, R.A., et al., “Multiresolution signal decomposition: transforms, subbands, and wavelets,” Academic Press, USA, 2001.
- Chen, B., Li, Y., Zeng, N., “Centralized wavelet multiresolution for exact translation invariant processing of ECG signals,” IEEE Access, 7, 42322–42330, 2019, DOI: 1109/ACCESS.2019.2907249.
- Zhu, J., Li, X., “Electrocardiograph signal denoising based on sparse decomposition,” Healthc. Technol. Lett, 4 (4), 134–137, 2017, doi: 1049/htl.2016.0097.
- Sameni, R., Shamsollahi, M.B., Jutten, C., “A nonlinear Bayesian filtering framework for ECG denoising,” IEEE Trans. Biomed. Eng, 54 (12), 2172–2185, 2007, DOI: 1109/TBME.2007.897817.
- Rakshit, M., Das, S, “An efficient ECG denoising methodology using empirical mode decomposition and adaptive switching mean filter,” Biomed. Signal Process. Control, 40,140–148, 2018, DOI:1016/j.bspc.2017.09.020.
- Singh, P., Pradhan, G., “Variational mode decomposition-based ECG denoising using non-local means and wavelet domain filtering,” Australas. Phys. Eng. Sci. Med, 41(4), 891–904, 2018, DOI: 1007/s13246-018-0685-0
- Kumar, A., Ranganatham, R., Komaragiri, R., “Efficient QRS complex detection algorithm based on fast Fourier transform,” Biomed. Eng. Lett, 9(1), 145–151. 2019, doi: 1007/s13534-018-0087-y.
- Jain, S., Bajaj, V., Kumar, A, “Riemann liouvelle fractional integral based empirical mode decomposition for ECG denoising,” IEEE J. Biomed. Health Inf, 22(4), 1133–1139, 2018, DOI:1109/JBHI.2017.2753321.
- Rajankar, S.O., Talbar, S.N, “An optimum ECG denoising with wavelet neural network,” Int. Conf. on Pervasive Computing (ICPC), Pune, 1–4, 2015, DOI:1109/PERVASIVE.2015.7087204.
- Kaergaard, K., Jensen, S.H., Puthusserypady, S, “A comprehensive performance analysis of EEMD-BLMS and DWT-NN hybrid algorithms for ECG denoising,” Biomed. Signal Process. Control, 25,178–187, 2016, DOI: 1016/j.bspc.2015.11.012.
- Kabir, M.A., Shahnaz, C, “Denoising of ECG signals based on noise reduction algorithms in EMD and wavelet domains,” Biomed. Signal Process. Control, 7 (5), 481–489, 2012, doi: 1016/j.bspc.2011.11.003.
- Kumar, S., Panigrahy, D., Sahu, P.K, “Denoising of electrocardiogram (ECG) signal by using empirical mode decomposition (EMD) with non-local mean (NLM) technique,” Biocybern. Biomed. Eng, 38(2), 297–312, 2018.
- Wang Y et al, “Design and evaluation of a novel wireless reconstructed 3-lead ECG monitoring system,” In: Proc. IEEE 2013 Biomedical Circuits and Systems Conference (BioCAS), Rotterdam, Oct, 362-365, 2013, DOI:1109/BioCAS.2013.6679714.
- Singh and A. Jasuja, “IoT based low-cost distant patient ECG moni- toring system,” International Conference on Computing, Communication and Automation, Greater Noida, 1330-1334, 2017, DOI:10.1109/CCAA.2017.8230003.
- Neyja, S. Mumtaz, K.M.S. Huq, S.A. Busari, J. Rodriguez and Z. Zhou, “AnIoT-Based E-Health Monitoring System Using ECG Signal,” IEEE Global Communications Conference, Singapore, 1-6, 2017, DOI: 10.1109/GLOCOM.2017.8255023.
- Yang, K. Yu, S. X. Yang, C. Chakraborty, Y. Lu and T. Guo, “An Intelligent Trust Cloud Management Method for Secure Clustering in 5G enabled Internet of Medical Things,” in IEEE Transactions on Industrial Informatics, doi: 10.1109/TII.2021.3128954.
- Gandhi, P., Khan, M. Z., Sharma, R. K., Alhazmi, O. H., Bhatia, S. et al. “Software Reliability Assessment Using Hybrid Neuro-Fuzzy Model,” Computer Systems Science and Engineering, 41(3), 891–902, 2022, DOI:32604/csse.2022.019943.
- Yang, Q. Zhou, L. Lei, and K. Zheng, “An IoT-cloud Based Wearable ECG Monitoring System for Smart Healthcare,” J. Med. Syst., 40(12),286, 2016, DOI: 10.1007/s10916-016-0644-9.
- Pal, “ECG monitoring: present status and future trend,” in: Reference Module in Biomedical Sciences Encyclopedia of Biomedical Engineering, Roger Narayan, Elsevier, ISBN 9780128051443, 363-379, 2017, DOI:10.1016/B978-0-12-801238-3.10892-X.
- Leo Louis, “Working Principle of Arduino and Using it as a Tool for Study and Research,” International Journal of Control, Automation, Communication and Systems (IJCACS), July 2018, DOI:5121/ijcacs.2016.1203.
- Miguel Bravo-Zanoguera, Daniel Cuevas Gonzalez, Juan Pablo Garc ́ıa- Vazquez, Roberto Lopez Avitia, Portable ECG System Design using the AD8232 Microchip and Open-source Platform, 6th International Electronic Conference on Sensors and Applications, 42(1), 2019, DOI:3390/ecsa-6-06584.
- Ayaskanta Mishra, Biswarup Chakraborty, Debajyoti Das, Priyankar Bose, “AD8232 based Smart Healthcare System using Internet of Things (IoT),” International Journal of Engineering Research, April 2018, DOI : 17577/IJERTV7IS040040.
- Bernard Abi-Saleh, Bassam Omar, “Einthoven’s Triangle Transparency: A Practical Method to Explain Limb Lead Configuration Following Single Lead Misplacements,” Reviews in Cardiovascular Medicine 11(1):33-8, 2010, DOI:3909/ricm0506.
- Freeman T. Bennett, MD, Kenneth R. Bennett, MD, Angel K. Markov, “MD, Einthoven’s Triangle: Lead Errors and an Algorithm for Solution,” The American Journal of the Medical Sciences, 329 (2), 71-77, 2005, https://doi.org/10.1097/00000441-200502000-00004
- Clifford, G.D, “ECG statistics, noise, artifacts, and missing data,” Adv. Meth. Tools ECG Anal, 6, 55–99, 2006.
- Friesen, G.M., Jannett, T.C., Jadallah, M.A., et al, “A comparison of the noise sensitivity of nine QRS detection algorithms,” IEEE Trans. Biomed. Eng, 37(1), 85–98, 1990, DOI: 1109/10.43620
- Van Alsté, J., Schilder, T, “Removal of base-line wander and power-line interference from the ECG by an efficient FIR filter with a reduced number of taps,” IEEE Trans. Biomed. Eng, 32(12), 1052–1060,1985, DOI: 1109/TBME.1985.325514
- Rana A, Chakraborty C, Sharma S, Dhawan S, Pani SK, Ashraf I, “Internet of medical things-based secure and energy-efficient framework for health care,” Big Data 3:X, 1–16, 2021, DOI: 1089/big.2021.0202
- Frølich, L., Dowding, I., “Removal of muscular artifacts in EEG signals: a comparison of linear decomposition methods,” Brain. Inform, 5(1),13–22, 2018, doi: 1007/s40708-017-0074-6
- Wagner et al., “PTB-XL, a large publicly available electrocardiography dataset,” Sci. Data, 7(1), 154, 2020, doi: 10.1038/s41597-020-0495-6.
- R. Fikri, I. Soesanti, and H. A. Nugroho, “ECG Signal Classification Review,” IJITEE Int. J. Inf. Technol. Electr. Eng., 5(1), 15, 2021, doi: 10.22146/ijitee.60295.
- Yadav, S. K., Sinha, R., and Bora, P. K, “Electrocardiogram signal denoising using non-local wavelet transform domain filtering,” IET Signal Proc. 9, 88–96, 2015, doi: 1049/iet-spr.2014.0005.
- Wu, Y. Lu, W. Yang, et S. Y. Wong, “A Study on Arrhythmia via ECG Signal Classification Using the Convolutional Neural Network”, Front. Comput. Neurosci., 14, 2021, DOI: 10.3389/fncom.2020.564015
- Awal, M. A., Mostafa, S. S., “Ahmad, M., and Rashid, M. A, “An adaptive level dependent wavelet thresholding for ECG denoising,” Biocyber. Biomed. Engin. 34, 238–249, 2014, doi: 1016/j.bbe.2014.03.002
- Atal, D. K., and Singh, M, “Arrhythmia classification with ECG signals based on the optimization-enabled deep convolutional neural network”, Comp. Methods Prog. Biomed. 196:105607, 2020, doi: 1016/j.cmpb.2020. 105607
- Acharya, U. R., Fujita, H., Oh, S. L., Hagiwara, Y., Tan, J. H., and Adam, M. “Application of deep convolutional neural network for automated detection of myocardial infarction using ECG signals”, Inform. Sci. 415, 190–198, 2017, doi: 1016/j.ins.2017.06.027.