Beyond Fitness: Revolutionary Exercise Tracker Combining Pose Recognition with Heart Rate Monitoring using Remote Photoplethysmography (rPPG)

 , Sadaf Kauser 2, Maniza Hijab 1, Gouri R Patil 1, Syeda Fouzia Sayeedunissa 1
Adv. Sci. Technol. Eng. Syst. J. 11(1), 33–43 (2026);
 DOI: 10.25046/aj110104
Heart rate (HR) is a critical indicator in fitness monitoring, athletic performance evaluation, and injury prevention. However, traditional motion-sensitive wearable devices are highly susceptible to movement artifacts, which degrade measurement accuracy during physical activity. Remote photoplethysmography (rPPG) offers a non-contact alternative for HR measurement, though it too remains sensitive to motion. This study proposes a novel framework that integrates MediaPipe’s BlazePose for bicep-curl motion tracking with rPPG-based real-time HR monitoring. The system leverages pose-estimation data to accurately track arm movements and applies advanced signal-processing techniques to suppress motion-induced noise in the rPPG signal, thereby enhancing HR estimation accuracy. The extracted signal is pre-processed using filtered, normalized, and transformed from the time domain to the frequency domain, enabling reliable HR extraction during continuous exercise. The green color channel is selected for BPM estimation, as it exhibits a strong correlation with cardiac pulse signals. Experimental results demonstrate that motion-corrected rPPG can effectively support real-time, non-contact HR monitoring during exercise. This approach shows strong potential as a platform for personalized fitness coaching and AI-based workout optimization. Future work will focus on extending the system to support multi-exercise tracking and continuous performance monitoring. The proposed framework enhances user safety by enabling early detection of abnormal heart rate patterns during exercise, such as tachycardia or irregular fluctuations caused by overexertion. By correlating physiological signals with biomechanical movement data, the system can adapt workout intensity in real time, ensuring exercises remain within safe cardiovascular limits. This closed-loop feedback mechanism supports individualized training plans tailored to the user’s fitness level and physiological response.
1. Introduction
The heart rate (HR) is an important physiological metric that reflects cardiovascular health, exercise intensity, and stress levels. It is used for fitness monitoring, medical diagnostics, and performance tracking [1]. Conventional HR measurement techniques, such as electrocardiography (ECG) [2] and photoplethysmography (PPG) [1] sensors, involve direct skin contact, which leads to discomfort and motion artifacts during dynamic activity. Wearable devices, although ubiquitously employed, have problems with accuracy in dynamic movement, limiting their real-time exercise tracking reliability.
To overcome these limitations, remote photoplethysmography (rPPG) has emerged as a non-contact alternative for HR measurement, extracting heart rate from subtle skin color variations in video footage [3], [4]. rPPG eliminates the need for physical sensors, making it suitable for continuous monitoring in fitness applications. Remote photoplethysmography employs camera hardware that detects minor changes in color due to the flow of blood, thus providing it with significant physiological quantities that include heart rate. This occurs during either the systolic phase, where higher oxygenated blood causes red coloration of the area involved, or the diastolic phase, whereby the red color is reduced in the area. This is essential for the functionality of rPPG. However, whereas temperature, light wavelength, and breathing all affect the normal PPG readings, they have little effect on rPPG readings, along with skin tone differences that introduce significant noise in rPPG-based HR estimation, reducing its accuracy [5]. Although green light is sensitive to volume variations of blood because it travels a shorter distance inside the skin than red or infrared light, it is relatively insensitive to motion in either PPG or rPPG, making it effective for real-time heart rate monitoring [9], [7].
Simultaneously, pose estimation methods, including DeepPose [8], Convolutional Pose Machines [9], OpenPose [10], and BlazePose [11], [12], have improved real-time exercise monitoring by precisely identifying body movement and joint locations. Of these, MediaPipe BlazePose is designed for mobile and embedded platforms and is thus particularly suited for real-time fitness monitoring [13]. Nevertheless, although pose estimation offers precise movement analysis, it does not include physiological information, such as HR monitoring.
This research introduces a new method that combines BlazePose pose estimation with rPPG real-time HR monitoring. Arm movement in exercises such as bicep curls is monitored using BlazePose from Mediapipe, and signal filtering algorithms are employed to mitigate rPPG noise to further enhance HR estimation accuracy. The Fast Fourier Transform (FFT) converts the discrete-time signal to the frequency domain, and finally, the magnitude of the signal is determined, which usually corresponds to the heart rate.
A contactless heart rate measurement system using remote photoplethysmography (rPPG) and body pose estimation was presented in this study. The system can process real-time video streams to determine a person’s heart rate from skin color changes while simultaneously following the person’s body movement. Instead of traditional wearable sensors, this novel approach allows HR monitoring that is comfortable and easy to use because it is non-invasive.
Using MediaPipe BlazePose for pose tracking and rPPG for signal extraction, the system can produce an accurate real-time HR estimation. Therefore, the subject carried out exercises, such as bicep curls, at an optimal camera distance of 1 meter under fixed light conditions. The results show the reps for the bicep curl along with heart rate in the form of BPM (beats per minute). The average heart rate was determined every minute, which represented the BPM. In addition, the system shows an alert message when the BPM surpasses the safe range of the BPM. OpenCV and Python were used in this implementation, which included computer vision-based tracking, delivering better HR estimation.
The remainder of this article is organized as follows. In related work, we describe the previous work, which has two parts: A. pose estimation algorithms and B. research on PPG and rPPG. The Proposed Method presents the methodology employed, including decoding BlazePose, along with the techniques applied for rPPG. Experimental Results describe the experimental setup implementation details and needs for performance evaluation. Finally, the Conclusion and Future Scope conclude the paper with a discussion of Future Work.
2. Related Work
2.1. Pose Estimation Algorithms
Recent state-of-the-art pose estimation has provided progress in both single-pose and multi-pose estimation. While single-pose estimation is also an effective way of tracking an individual’s movements, multi-pose estimation, on the other hand, is a non-negotiable point for real-world situations where many people are involved, for example, sports, fitness exercises, or crowd monitoring. The task is to successfully capture all key points that are visible and reduce occlusions. The challenge lies in maintaining precision despite rapid movements, occlusions, and variations in lighting or viewpoint.
In [14], The authors have used the blaze-pose to identify the behaviour of the driver and raise an alarm, if he is found drunk or sleepy to avoid accidents.
In [8], the author proposed DeepPose, which is a deep-learning-based approach for human pose estimation. Deep Pose is a deep neural network (DNN)-based regression algorithm for human pose estimation that encodes body joints as pose vectors and normalizes them relative to a bounding box for consistency. The Convolutional Neural Networks CNN specifically AlexNet, predict the joint coordinates directly from the image, process the rectified linear units (ReLU), and locally normalize the responses (LRN) for feature extraction. A sequence of regressors enhances each other by iteratively correcting inference errors. When it comes down to speed, DeepPose is not the case for improving the process speed, neglecting real-time fitness tracking and motion analysis software.
In [9], the author developed Convolutional Pose Machines, a multi-stage CNN that aims to iteratively refine human pose estimation by exploiting contextual information and spatial relationships. The entire process begins with feature extraction; here, convolutional layers examine the input image to derive pose-related features of vital importance. The computed heat maps provide probabilities for each of the body’s key points. During training, intermediate supervision is reinforced as predicted heatmaps are compared with ground truths, which allows the model to learn stepwise. Through such iterative refinement, the CPM model improves predictions through the application of probabilistic heat maps, thus resulting in more accurate localization of the joints. The final pose estimation comes from the precise localization of key points with the aid of finer heatmaps. In [9], the use of multiple stages and intermediate supervision allows CPMs to better capture occlusions and enhance the accuracy of pose estimation. However, the added complexity of multi-stage processing also makes real-time applications challenging. Nevertheless, CPMs gave a major push in the progress towards deep learning-based human pose estimation that ushered many lines of follow-up research to further improve body tracking systems.
In [10], the author introduced OpenPose, a real-time multi-person posture estimation framework to track and identify important human body points in a single image. By initially recognizing individual body parts and connecting them to create a complete pose, OpenPose employs a bottom-up methodology. To detect body parts, a convolutional neural network (CNN) with a two-stage architecture is used. The first stage predicts confidence maps, whereas the second stage estimates the Part Affinity Fields (PAFs) to create connections between parts. The framework uses a VGG-19 network to extract features and then a custom network to iteratively refine predictions.
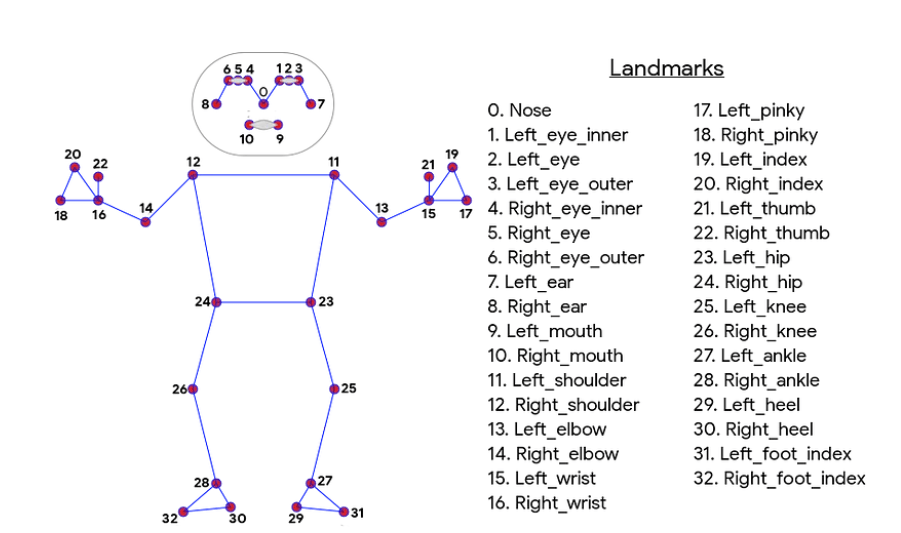
In [11], the author presented BlazePose, an efficient and lightweight pose estimation model optimized for real-time use on mobile devices. It builds on MobileNetV1 and uses depth-wise separable convolutions to reduce computational overhead [13]. BlazePose is better suited for tracking a single individual and offers more detailed movement analysis. In total, 33 important points were supported. The two-stage pipeline begins with a person’s detection and joint location approximations. Subsequently, pose estimation was improved using regression-based approaches. BlazePose is particularly helpful for real-time applications, such as fitness tracking and posture correction, but it has a disadvantage in that it cannot track multiple persons at once.
The intersection over union (IOU), which increases bounding box accuracy, and non-maximum suppression (NMS), which filters redundant key-point detections, further boost BlazePose’s efficiency. It is a better framework for real-time pose estimation because it does not undergo iterative refinement, which delays the extraction of correct joint points. In addition, BlazePose uses a depth-wise Separable CNN, which increases the efficiency and reduces the computation cost, which is further explained in the proposed method. BlazePose is a powerful substitute for AI-driven fitness apps because it runs 25–75 times faster on mobile CPUs than its counterparts. The lack of multi-person tracking is a significant drawback. The proposed method captures the joints of a single individual in real-time, and BlazePose is considered a better choice.
2.2. Heart Rate Estimation using PPG and rPPG
Photoplethysmography (PPG), a popular optical method for tracking heart rate, detects changes in light absorption or reflection via the skin to determine blood volume changes. A photodetector measures the reflected or transmitted light according to the blood volume in the lighted region, and PPG sensors typically use red, green, or infrared light to record arterial blood volume variations [5]. PPG is less dependable in dynamic situations such as exercise because it is greatly impacted by motion aberrations, ambient light interference, and skin tone fluctuations, even if it is very accurate in static situations such as the supine position with an error margin of approximately 5% [15].
Remote photoplethysmography (rPPG) is a contactless alternative to traditional PPG for measuring physiological signals such as blood volume changes and heart rate. Unlike conventional PPG, which requires direct skin contact with optical sensors, rPPG analyzes subtle color changes in the facial skin caused by blood flow using video-based techniques [8]. This technology has gained significant interest in telemedicine, fitness tracking, and healthcare owing to its non-invasive nature. However, real-world challenges such as variations in skin tone, lighting conditions, and motion artifacts still hinder its accuracy. This section explores the key advancements in rPPG research, focusing on methods to enhance real-time performance, address environmental challenges, and improve signal quality.
In [16], the author proposed a procedure for extracting the blood volume pulse (BVP) waveform using signal processing, face detection, and source signal reconstruction based on the camera-recorded video signals. ROI selection followed by the selection of the green channel was made in the RGB signal, then spatially averaging the channel, processing the average signal through an eleven-point moving-average filter that smoothed it out, and then removing the trend and standardizing it. Independent Component Analysis (ICA) was used to find the most vital component by decomposing all the signals into independent components and selecting the component with the maximum peak in the power spectrum. The BVP waveform was deconvolved using five frequency extraction techniques: Discrete Time Fourier Transform (DTFT), Discrete Short-Time Fourier Transform (STFT), Discrete Wavelet Transform (DWT), Peak Counting, and Mean Value of Inter-beat Interval (IBI). The findings of experiments on 15 participants in both resting and post-exercise states, verified by a wearable pulse sensor, demonstrated that IBI performed better than all other methods in HR accuracy.
In [17], the author proposed a continuous HR measurement method that employs a video of the face, focusing on the cheek region as a stable ROI. RGB signals are sent to the chrominance space to be filtered and analyzed using the FFT. A temporal HR distribution model was introduced to increase stability, while the median fusion of sub-ROIs was employed to enhance accuracy.
In [18], the ascertained heart rates were evaluated by evaluating various types of skin over time. They relied on face detection with Haar cascades for forehead tracking of the entire video. Each frame representing the average pixel intensity within the ROI was processed using FFT to obtain heart rate frequencies (0.5–3 Hz) with an error of 3%, practically remaining constant in the case of various skin tones. Accuracy was confirmed through testing and comparing the Ambiotex and Fitbit Alta HR wearable devices.
In [19], the researchers proposed a real-time heart rate measurement framework that integrates Viola-Jones face detection, tracking, and skin detection to robustly extract the region of interest (ROI) from video frames. Linear Discriminant Analysis reduces dimensionality to enhance the quality of the green-channel plethysmographic signals. Heart rate frequencies (0.7–4 Hz) were isolated using a Hamming window-based band-pass filter, followed by spectral analysis to extract the peak heart rate.
In [20], the author demonstrated that heart rate can be estimated from facial videos by detecting the face as a Region of Interest ROI using the HSV color space. The extracted face was then decomposed into RGB channels with an average pixel intensity. Signal processing was implemented to enhance the signal quality using baseline removal and band-pass filtering. Cross-correlation is applied between two signals to measure their similarity and identify shared periodic components, thereby reducing the uncorrelated noise. Independent Component Analysis was employed for signal separation, and the dominant frequency corresponded to the heart rate identified using the Fast Fourier Transform.
In [21], the author proposed an algorithm that turned out to be a deliberately improved way to measure heart rate on fitness videos using precise motion compensation that used optical flow and Viola-Jones for face detection. Illumination changes and heart rate isolation were performed by using a bandpass filter. The proposed method demonstrated Root Mean Squared Error RMSE (1.1 bpm) and a relative error (0.58%). However, video-based heart rate monitoring methods typically perform poorly during strenuous exercises of high-motion-induced motion, where rapid movements and partial or total body occlusions cause artifacts that are difficult to remove. Adaptive filtering or motion-aware segmentation can be realized in the future to eliminate these obstacles.
In the proposed work, a combination of a Butterworth bandpass filter and Fast Fourier Transform is employed to enhance the signal quality and extract meaningful features. The Bandpass filter discards unwanted noise, allowing only the accepted frequencies (0.7 Hz – 3.0 Hz). The filtered signal is converted into the frequency domain from the time domain by Fast Fourier transform, allowing for easier feature extraction and identification of dominant frequency components. For ICA, PCA, and LDA, which focus predominantly on signal separation or dimensionality reduction rather than on frequency analysis, FFT analyzes frequency patterns with a high resolution for near-signal patterns that are challenging to evaluate. The Butterworth Bandpass filter and FFT enhance the efficiency and accuracy of the model, thereby rendering it robust for signal processing and pattern recognition.
3. Proposed Method
3.1. BlazePose from Mediapipe
Media Pipe is a powerful and versatile framework for building ML solutions. Through the prebuilt component “BlazePose,” Media Pipe offers a complete solution for estimating human poses. The BlazePose was designed for efficient and accurate pose estimation in real-time applications. The BlazePose model is the most basic and supports 33 key points. Media Pipe Pose Estimation uses a two-stage pipeline to estimate the 3D pose of a person in an image or a video frame. In the first stage, a Robust Pose Detection model is used to detect the presence of a person in the frame and estimate the approximate rough location of the person’s body joints. In the second stage, a Pose Estimation model is used to refine the location of a person’s body joints and estimate the 3D pose of the person [11], [12]. The BlazePose training dataset consists of 60K images with a single or few people in common poses and 25K images with a single person performing fitness exercises.
The BlazePose from MediaPipe offers a pre-trained pose estimation model. A real-time compact pose estimation algorithm was created by Google. It operates effectively across platforms, including web applications and mobile devices. For joint detection and regression, BlazePose employs a variant of the Single-Shot Multi-Box Detector (SSD) and Part Affinity Fields (PAFs) to record the connections between body joints. The BlazePose can estimate the 2D connections and locations of numerous body joints in real-time.
BlazePose in MediaPipe uses a CNN architecture based on the MobileNetV1 architecture [13]. For effective inference on mobile and embedded devices, MobileNetV1 is a compact CNN architecture. To reduce computational complexity while maintaining a reasonable accuracy level, it uses depth-wise separable and pointwise convolutions. The BlazePose key-point topology is illustrated in Figure 1. The Figure 1 shows 33 anatomical points used by BlazePose for pose estimation, Note. Adapted from [12].
3.1.1 Model Architecture and Pipeline Design
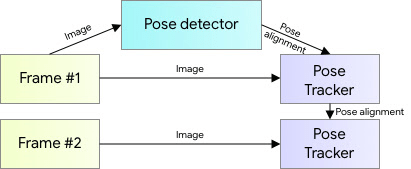
As shown in Figure 2, BlazePose uses a detector–tracker architecture for inference, which exhibits excellent real-time performance for tasks such as hand landmark prediction and dense face landmark prediction. A pose tracker network follows a lightweight body-pose detector in the pipeline. The tracker predicts the key-point coordinates, the person’s presence in the current frame, and the refined region of interest for the current frame. A flow chart in figure 2, illustrates the two-stage pipeline of BlazePose, with key-point detection followed by refinement of the key-point position.
BlazePose Detector: The BlazePose Detector locates the body joints and calculates the initial pose. It uses the Single-Shot Multi-Box Detector (SSD) framework, a well-liked object-detection system. In real-time object detection, SSDs are renowned for their effectiveness and efficiency. The BlazePose Detector extract features by processing an input image through several convolutional layers. Regression and detection are performed using these features. The network estimates the bounding boxes enclosing each body joint while forecasting the confidence scores for the presence of each joint. The BlazePose Detector runs an input image through multiple convolutional layers to extract information. These features were then used for both detection and regression. The network predicts confidence scores for the existence of each bodily joint and calculates the bounding boxes surrounding each joint.
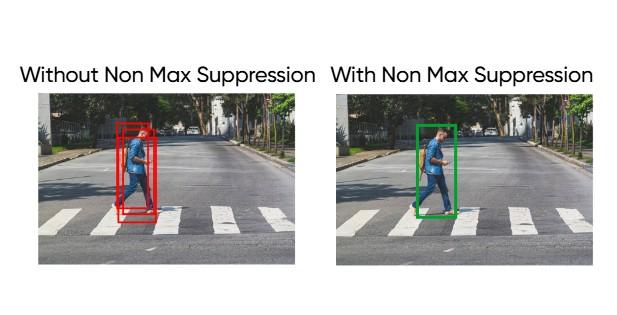
The Single Shot Multi-Box Detector (SSD) framework uses a Convolutional Neural Network (CNN) to estimate the pose in an image. The CNN creates feature maps with default boxes for body joints. Each box is classified and regression-trained, with the CNN forecasting confidence scores and regression offsets. A non-maximum suppression algorithm eliminates overlapping detections and results in a clear set of pose estimations, as illustrated in Figure 4.
3.2. Non-maximum Suppression
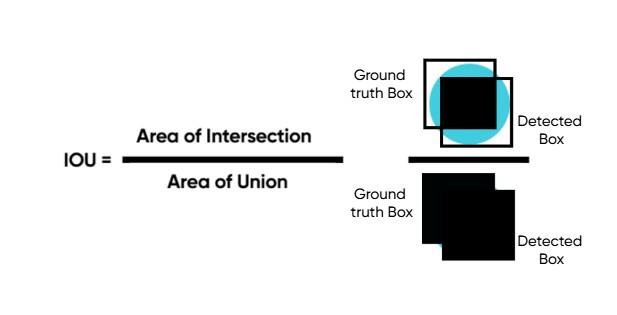
Input: Lists of proposal boxes B, matching confidence scores S, and overlap threshold N are inputs. The anchor and proposal boxes were identical. From Figure 3, the Intersection Over Union (IOU) is a method used to measure the overlap between the two proposals.
Output: A filtered list of D’s proposals.
- Choose the proposal with the highest confidence score, move it out of B, and include it in List D of the final proposals. D is initially empty.
- At this point, we compare this proposal to all others and determine its Intersection over Union (IOU). Consider the proposal out of B if the IOU exceeds the threshold N.
- Select the proposal again from B with the highest degree of confidence, remove it from B, and add it to D.
- Compute the IOU of this proposal with all of the proposals in B once more, and then cross out the boxes whose IOU is greater than the
- This process was repeated until no additional proposals remained.
An illustration shows in figure 3, how the Intersection over Union (IOU), which is used to determine object detection accuracy, is computed by dividing the area that two bounding boxes overlap by the total area that both boxes cover.
The figure 4, demonstrates how non-maximum suppression filters overlapping bounding boxes and considers only the most confident predictions.
The BlazePose Refiner enhances the initial pose estimates from the BlazePose Detector using Part Affinity Fields (PAFs) to calculate the relationships between body joints. These 2D vector fields store information regarding the direction and strength of the connections between the joints. BlazePose can infer the relative positions and orientations of joints and build the entire pose estimation by estimating these connections. With the initial joint detection, the BlazePose Refiner predicts the PAFs for joint connections, resulting in more precise and thorough pose estimations.
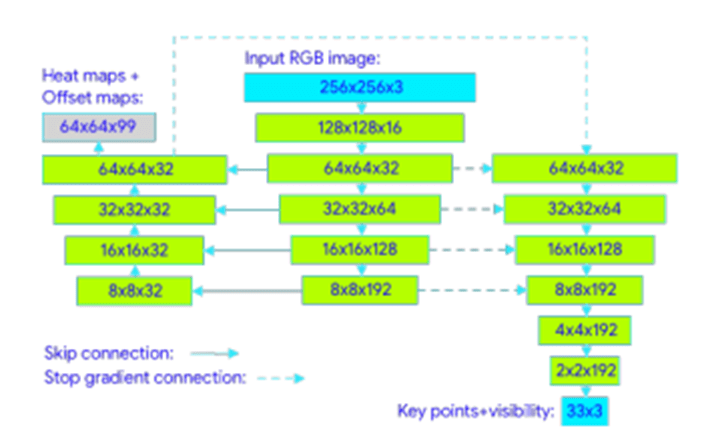
The CNN architecture in BlazePose uses heatmap and offset losses to manage lightweight embedding, which represents the presence and location of body joints in the heat maps. Heatmap loss helps supervise lightweight embedding, whereas offset loss refines joint positions by predicting the offset values. During inference, the output layers associated with the heatmap and offset were removed, resulting in only the regression encoder network being used. This network takes lightweight embedding as input and performs regression to predict precise joint positions based on the embedded information. Figure 5 illustrates the BlazePose CNN architecture, highlighting heatmaps and offsets for joint localization.
3.3. BlazePose CNN Architecture.
Block diagram of the BlazePose model architecture in figure 5, showing layers for feature extraction, regression, and pose refinement.
3.3.1 How Depth-wise Separable Convolution is better than Conventional Convolution Neural Networks?
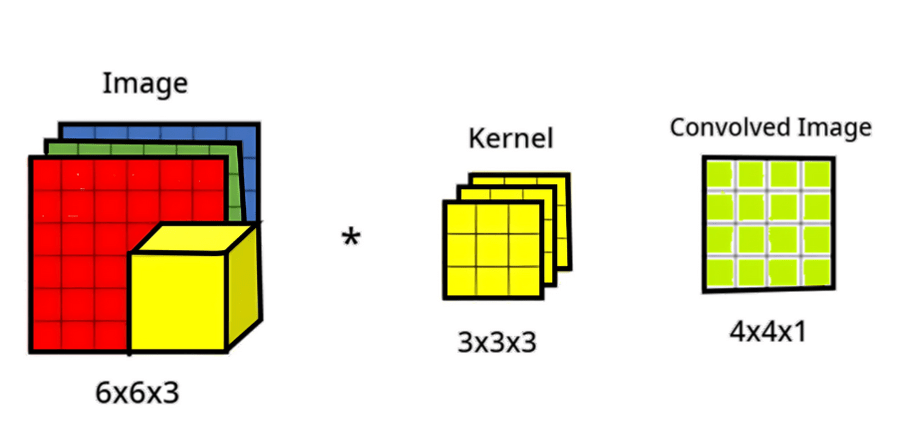
Figure 6 represents the conventional convolutional neural network, where a filter or kernel convolves the input data to produce a feature map. A convolutional neural network uses an RGB image with dimensions of 6 × 6 × 3 for the height, width, and channels, respectively. There must be an equal number of channels in the filter and the image. The result is a 4 × 4 image. Note that the final image is now 4 × 4 × 1 instead of 4 × 4 × 3.
Output Dimension: (n-f +2p) / s + 1, where p and s are the padding and stride, respectively.
Input Dimension: n
Kernel Dimension: f
The kernel size was 3 × 3 × 3, representing the height, width, and number of channels. The kernel cube of size 3 × 3 × 3 slides the RGB image, and in each move, it covers the nine cells of each RGB image. After the entire traversal, the extracted feature has a size of 4 × 4. Figure 6 is illustrating a 2D convolution applied to a 6 × 6 × 3 RGB image with a 3 × 3 × 3 kernel to generate a 4 × 4 output feature map.
3.3.2 Depth-wise Separable Convolution Neural Network
The architecture of a Depth-wise Separable Convolutional Neural Network consists of d Depth-wise and Point-wise Convolutional layers [13].
3.3.3 Pointwise Convolution
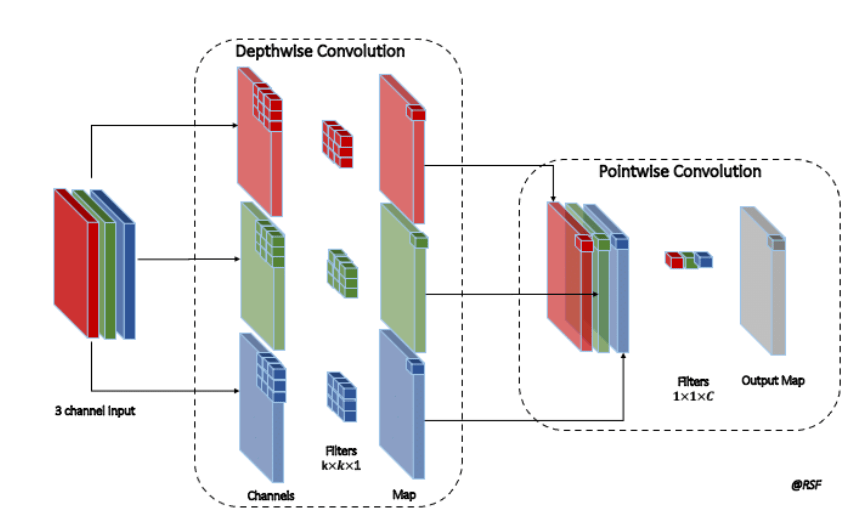
The pointwise convolution, 1 × 1 convolution, is the second stage. Figure 7 shows that the feature maps generated from the depth-wise convolution are subjected to a 1 × 1 filter. The bottleneck layer, that is, pointwise convolution, increases the number of channels while maintaining the same spatial dimensions. Pointwise convolution, which employs a 1 × 1 filter, enables linear combinations of channels, allowing the model to learn intricate correlations between features.
3.3.4 Depth-wise Convolution
The depth-wise convolution is the initial phase in depth-wise separable convolution. In Figure 7, depth-wise convolution applies a separate 3 × 3 filter to each independent input channel, unlike typical convolutions that employ a single 3 × 3 (generally n × n) filter across all input channels. This implies that each input channel is analysed independently to capture the spatial information contained within that channel. Depth-wise separable convolution, which splits conventional convolution into two phases to reduce computing complexity, is illustrated. First, depth-wise convolution applies different k × k × 1 filters to each input channel (red, green, and blue) to maintain spatial properties. Then, point-wise convolution merges them across channels using 1 × 1 × C filters, where C is the number of output channels in the final feature map.
3.4. Conventional CNN vs Depth-wise Separable CNN
Figure 6 shows an input RGB image with three input channels of 6 × 6 × 3 and a kernel size (f) of 3 × 3 × 3 in a conventional convolutional neural network that generates a feature map of 4 × 4.
Input Image size(n): (6,6)
Kernel size(f): (3,3)
Number of Channels: 3
Output Image size: (n-f +2p)/s +1, where the padding = 0 and stride = 1
Output Image size: (6-3+2×0)/1 + 1 = 3+1 = 4
For one tensor, there are (3 × 3 × 3) × 16, i.e., 27 × 16, i.e., 432 tensor operations. For 256 such feature maps, there are 27 × 16 × 256, i.e., 110592 operations that take place.
For the same dimensions of the input image of 6 × 6 × 3, in a depth-wise separable Convolutional Neural Network, a depth-wise convolution is performed on each 6 × 6 × 1 with a filter size (k) of 3 × 3 × 1 each. Because the number of input channels is three, an output image of 4 × 4 × 3is obtained.
The number of tensor operations in a depth-wise separable convolutional neural network for one tensor is (3 × 3 × 3) × 16, i.e., 432.
The output of the Depth-wise separable Convolutional Neural Network was 4 × 4 × 3. For 256 such feature maps, the number of operations required is (4 × 4 × 3) × 256, i.e., 12288. In total, the number of operations for 256 tensors is 432 + 12288, i.e., 12,720, which is far less than 110592. The output after the pointwise convolution is 4 × 4 × 1 by applying a filter of 1 × 1 × 3 to the output of the depth-wise convolution 4 × 4 × 3.
Table 1: CNN vs Depth-wise Separable CNN
| Aspects | Conventional CNN | Depth-wise Separable CNN |
|---|---|---|
| Input Image Size (n) | (6, 6) | (6, 6) |
| Kernel Size (f) | (3, 3) | (3, 3) |
| Number of Channels | 3 | 3 |
| Padding | 0 | 0 |
| Stride | 1 | 1 |
| Output Image Size (per channel) | (4, 4) | (4, 4) |
| Number of Tensors | 256 | 256 |
| Operations on Tensor | (3 × 3 × 3) × 16 = 432 | (3 × 3 × 3) × 16 = 432 |
| Total Operations on 256 Tensors | 110,592 | 12,720 |
| Layers Included | Convolutional, Pooling, Fully Connected | Depth-wise Convolution, Point-wise Convolution |
| Operation Philosophy | Single filter applied across all channels | Different filters for each channel (Depth-wise), followed by linear combinations (Point-wise) |
| Efficiency Benefit | Standard performance, higher computation | Reduced computation, maintains performance with lower computation |
| Parameter Efficiency | Higher parameter counts per channel | Lower parameter counts per channel |
| Computational Efficiency | Lower efficiency due to redundant computation | Higher computational efficiency by applying depth-wise and point-wise separately |
| Execution Speed | Slower due to higher computations | Faster due to reduced computations |
| Feature Extraction | Channels combined for feature extraction | Channels are independently extracted and combined later (Depth-wise) |
The Depth-wise Separable Convolution Neural Network performs Depth-wise and Pointwise Convolutions separately, reducing computational complexity and improving efficiency. The differences between a conventional convolutional neural network and a depth-wise separable convolutional neural network, based on various aspects, are demonstrated in Table 1. The parameters in Table 1 are based on the example described in Figures 6 and 7.
3.5. Remote Photoplethysmography (rPPG)
Remote photoplethysmography uses camera hardware to measure subtle color changes caused by blood flow, providing important physiological data such as heart rate. This occurs either during the diastolic phase, when the red color shrinks in the affected area, or during the systolic phase, when increased oxygenated blood causes the area to become red. An image of the RGB channel was captured. In the proposed methodology, the green channel is used to capture the heart rate frequency, as it corresponds highly to the heart rate signals [16], [8].
3.6. Face Detection and ROI Selection
The two computer vision technologies used in this study are (1) face identification and (2) pose estimation with MediaPipe’s BlazePose. The purpose of the experiment was to measure the heart rate (measured in beats per minute) while engaging in a simple bicep curl exercise. OpenCV uses Haar cascades, first presented in [23], to implement face detection. With varying weights, the identified faces were separated into three regions of interest (ROIs). The first ROI was assigned the highest weight of 0.5, which spans from the forehead to the eyes. A weight of 0.3 is given to the second ROI, which covers the nose and cheeks, and 0.2 is given to the second ROI and to the third ROI, which extends from the upper lip to the chin. Because it is more likely to move than the forehead, which remains mostly stationary, the lower portion of the face is given less weight. During the bicep curl exercise, arm movements were tracked using the MediaPipe’s BlazePose estimate. The elbow flexion angle was calculated using important landmarks of the wrist, elbow, and shoulder. The up and down phases of the movement are determined by the system based on the angle. When the change from the down phase to the up phase was observed, a repetition was recorded.
3.7. Heart Rate Estimation
The methodology consists of three key stages: (1) Signal Preprocessing, (2) Frequency Analysis, and (3) Heart Rate Computation.
3.8. Signal Preprocessing
A Butterworth bandpass filter was used for signal preprocessing to allow frequencies within a specific range while attenuating frequencies outside of this range [24]. The Butterworth filter is preferred because it has a maximum flat frequency response in the passband, resulting in minimal signal distortion. It is based on the Nyquist theorem (1), which asserts that a continuous signal may be reliably reconstructed if sampled at a rate at least twice that of the highest frequency component of the signal.
$$
f_N = \frac{f_s}{2}
\tag{1}
$$
where is the Nyquist frequency and is the sampling rate in hertz.
According to the Nyquist rule (2), the sampling rate must be at least twice the maximum frequency component of the signal, given by (2)
$$
f_s \geq 2f_{\max}
\tag{2}
$$
This approach ensures that all of the frequency components of the signal are captured without losing information. For example, if a signal oscillates at a maximum frequency of 10 Hz, the minimum required sampling rate is calculated as in (3)
$$
f_s \geq 2 \times 10 = 20\,\text{Hz}
\tag{3}
$$
Thus, at least 20 samples per second must be captured to accurately reconstruct a 10-Hz signal. This technique ensures effective filtering and signal integrity while limiting sampling artifacts and distortions.
After calculating the sampling rate, the frequencies were normalized by dividing by the low-cut and high-cut frequencies based on the Nyquist frequency. This ensures that the filter performs correctly in the normalized frequency domain. The normalized frequencies were calculated using (5).
$$
f’_L = \frac{f_L}{f_N},
\quad
f’_H = \frac{f_H}{f_N}
\tag{5}
$$
Butterworth remove unwanted frequencies and preserve the desired frequencies. The order in the Butterworth filter specifies the steepness of the transition between the bandpass and stopbands. The Butterworth filter eliminates undesirable frequencies while retaining permitted frequencies. The filter order controls the steepness of the transition between the passband and the stopband. In the proposed model, the frequency range considered is between 0.7 Hz to 3.0 Hz, which highly corresponds to the heart rate frequency in Hz [25]. The Butterworth filter transfer function is represented as in (6), where represents the complex frequency and denotes the order of the filter, which indicates how strong the filter is or determines the frequency to allow. represents the cut-off frequency.
$$
f’_L = \frac{f_L}{f_N},
\quad
f’_H = \frac{f_H}{f_N}
\tag{5}
$$
For instance, if the cutoff frequency is 1.0 Hz, consider two scenarios: 1. A signal frequency below the cutoff of 0.5 Hz, 2. A signal frequency above the cutoff of 5.0 Hz.
For the frequency 0.5 Hz, with order gives the . This implies that 97% of the signal passes through, and the filter attenuates the signal by 3%. For the cutoff frequency Hz, with order computes the . This indicates that 70% of the signal strength remains, and the filter attenuates the signal by 30%. Here, the Hz, with order calculates the , which says only 4% of the signal passes through.
Digital filters are essential for selectively permitting or suppressing particular frequency components of signals during signal processing. The function of a filter is determined by its coefficients, which define the stop-band (attenuated frequencies) and band-pass (permitted frequencies). Usually, a difference equation of the following type is used to apply a digital filter, where calculated using (7), is the output signal at the timestep and is the input signal at the time . and represent the set of coefficients that determine the influence of the input signal on the output signal and the impact of previous output values on the current output respectively.
$$
y[n]
=
b_0x[n]
+
b_1x[n-1]
+
b_2x[n-2]
+\cdots
–
a_1y[n-1]
–
a_2y[n-2]
-\cdots
\tag{7}
$$
The filter was applied twice, and phase shifts were introduced in the forward direction. The phase shifts introduced in the forward pass were eliminated when the filter was used again in the reverse direction. This technique, called zero-phase filtering, successfully eliminates noise while maintaining the timing of the important signal properties.
3.9. Frequency Analysis: Frequency Resolution and Sampling
The Fast Fourier Transform (FFT) is utilized for the frequency analysis to convert the time domain to the frequency domain [26]. The resolution of the FFT is defined as the ratio of the sampling rate to the number of samples.
$$
\Delta f = \frac{f_s}{N}
\tag{8}
$$
For instance, if = 100 Hz and =1000 samples, the resolution is generated as in (8) is . Closely spaced frequency components, such as 1 Hz and 1.1 Hz, can be easily distinguished with greater resolution (e.g., 0.1 Hz). In comparison, with = 100 Hz and = 200 samples, the resolution was . FFT with a lower resolution cannot clearly distinguish two peaks of frequency that are close (e.g., 0.1 Hz). The heart-rate signal must be captured at a high-resolution frequency.
3.10. Discrete Fourier Transform (DFT)
The Fast Fourier Transform (FFT) computes the Discrete Fourier Transform (DFT), which transforms a discrete-time signal into its frequency domain representation as calculated (9). The DFT identifies the frequency components in a filtered heart rate signal and measures the amplitude (or strength) of each frequency component in the signal. The identification of significant frequencies is essential for an analysis of heart rate variability. The Discrete Fourier Transform equation is as follows
$$
X[k]
=
\sum_{n=0}^{N-1}
x[n]\,
e^{-j\frac{2\pi}{N}kn},
\qquad
\text{for } k = 0,1,\ldots,N-1
\tag{9}
$$
Any periodic signal, including the heartbeat, can be broken down into the Fourier Series, which is a sum of sine and cosine functions. The amplitudes of the cosine components (horizontal oscillations) and the sine components (vertical oscillations) are represented by the real and imaginary parts of the complex number . This transformation measures the amplitude of each frequency component by computing the magnitude of .
The sampling period, which is calculated as the inverse of the frame rate, is the time that passes between successive frames. For example, if the frame rate was 10 fps, the sample period would be . This implies that 10 samples were acquired per second. The largest frequency that can be accurately measured, or the Nyquist frequency, is equal to half the sampling rate according to the Nyquist theorem. Thus, at a sampling rate of 10 Hz, the Nyquist frequency is ; which is the highest frequency identified in the signal.
3.11. Heart Rate Computation
The FFT outputs a symmetric spectrum with negative and positive frequencies as defined by Hertz. However, only the magnitudes corresponding to the positive frequencies were considered in the computation. The frequency with the maximum amplitude, or the peak frequency, was then determined to be the principal frequency of the signal. In the proposed model, the BPM ranges from 42 to 180 BPM when the frequency is considered in the range of 0.7 Hz to 3.0 Hz. The heart rate (beats per minute) was calculated by multiplying the recorded peak frequency (in Hz) because 60 seconds make up one minute. For instance, the heart rate was 60 beats per minute (BPM) when the peak frequency was 1 Hz. The denotes the significant frequency obtained from the FFT, and the is computed as follows: (10).
4. Experimental Results
In this study, four candidates with varying skin tones, such as light, medium, and brown, participated in experiments with ages ranging from 20 to 25 were considered. The candidates were not wearing any makeup or face accessories that covered their faces, such as scarves, spectacles, or caps. The experiment was performed twice, and each participant was tested five times. The experiment was first performed in a room with a 20-watt tube light. The second experiment was performed with the same candidates in the same room under a 40-watt tube light. The distance between the candidates and the camera was 1 meter. During each session, participants performed bicep curls for one minute, and the system recorded their heart rate in beats per minute (BPM). BlazePose was used to continually track the candidate’s motions and show the number of repetitions on the screen, ensuring that participants maintained a consistent level of intense activity throughout the test. After each session, a Dr. Trust Signature Series oximeter provided reference BPM readings for each trial, which takes approximately 5 to 10 seconds to show the oximeter readings. This dual-measurement method directly compared the BPM estimates from our rPPG model and oximeter readings.
The BPM values calculated using the rPPG approach were compared and contrasted with the oximeter reference readings to test the effectiveness of our methodology. Metrics such as the Mean Absolute Error (MAE), Root Mean Squared Error (RMSE), and Mean Absolute Percentage Error (MAPE) were used to calculate the error rate. MAPE (10) is particularly convenient because it states the error as a percentage of the true value, allowing intuitive interpretation and easier comparison between subjects or conditions with differently sized BPMs. MAPE was calculated as follows:
$$
\mathrm{MAPE}
=
\frac{100}{5}
\sum_{j=1}^{5}
\left|
\frac{\mathrm{BPM}_{\mathrm{model}}(j)-\mathrm{BPM}_{\mathrm{oximeter}}(j)}
{\mathrm{BPM}_{\mathrm{oximeter}}(j)}
\right|
\tag{10}
$$
For each candidate, the experiment was conducted five times, where represents the count, is the system’s BPM value, and denotes the oximeter reading for the BPM value for trial.
Table 2 represents the features such as age, gender, and skin tone of each candidate. MAPE I and MAPE II in Table 2 represent the mean absolute percentage error for the respective candidate in the room with ambient light intensities of 20 watts and 40 watts, respectively. The above table figures show that the percentage error is high for low ambient light intensity, and the percentage error is low for high ambient light intensity, irrespective of skin tone and gender.
Table 2: Experimental Results
| Candidate | Features | Results | |||
|---|---|---|---|---|---|
| Age | Gender | Skin Tone | MAPE I | MAPE II | |
| Person 1 | 25 | Female | Medium | 15% | 10% |
| Person 2 | 21 | Male | Light | 14% | 7% |
| Person 3 | 22 | Female | Light | 16% | 7% |
| Person 4 | 20 | Female | Brown | 13% | 8% |
The results show that the non-contact method is promising for real-time cardiovascular monitoring, despite the difficulties caused by high-motion activities and slight differences in the testing distance. A mechanism that alerts users when the BPM exceeds a predetermined intensity range was also included. By providing real-time alerts, this feature not only makes the system more helpful but can also be used for personal health monitoring, allowing users to be promptly notified if their heart rate exceeds permissible limits. However, these findings also target at the possible areas for development, such as improving motion compensation methods and fine-tuning the rPPG signal-processing pipeline to lower the error margin. The aim of the proposed system is to continuously monitor an individual’s heart rate and generate timely alerts in the event of abnormal or risky fluctuations that could severely impact health. In addition, the system supports and optimizes fitness activities through AI-based workout recommendation and optimization techniques. In today’s fitness-driven culture, activities such as Zumba, gym workouts, Aerobics, Dance fitness, Cardio workouts, CrossFit, Circuit training, and yoga to name a few exercise routines; that are often performed without expert supervision or medical guidance. This proposal addresses the associated health risks by enabling intelligent monitoring and personalized fitness optimization.
6. Future Scope
Future research will focus on enhancing motion compensation and ROI tracking to improve rPPG accuracy in numerous applications, along with a shift to include gyroscope data to enhance body-orientation tracking and movement identification. The use of exercise volumes that are more AI-driven can potentially lead to better versions of exercise becoming a reality, such as providing constant posture correction and real-time heart rate monitoring. Physiotherapy and telemedicine health monitoring are two medical application scenarios that can be explored to aid patients’ recovery and avoid heart stress. In addition, non-invasive heart rate monitoring and posture detection methods can be attained by combining exercise apps, fitness centers, and AI-powered coaching to support the modernization of health and activity tracking.
- J. Allen, “Photoplethysmography and its application in clinical physiological measurement”, Physiological Measurement, 28(3): R1-R39, 2007, DOI: 10.1088/0967-3334/28/3/R01
- G. Guven, H. Gurkan, U. Guz, “Biometric identification using fingertip electrocardiogram signals”, Signal, Image and Video Processing, 12(5): 933-940, 2018, DOI: 10.1007/s11760-018-1238-4
- W. Verkruysse, L. O. Svaasand, J. S. Nelson, “Remote plethysmographic imaging using ambient light”, Optics Express, 16(26): 21434-21445, 2008, DOI: 10.1364/OE.16.021434
- T. Wu, V. Blazek, H. J. Schmitt, “Photoplethysmography imaging: a new noninvasive and noncontact method for mapping of the dermal perfusion changes”, Optical Techniques and Instrumentation for the Measurement of Blood Composition, Structure, and Dynamics, 4163: 62-70, 2000, DOI: 10.1117/12.407646
- P. H. Charlton, P. A. Kyriacou, J. Mant, V. Marozas, P. Chowienczyk, J. Alastruey, “Wearable Photoplethysmography for Cardiovascular Monitoring”, Proceedings of the IEEE, 110(3): 355-381, 2022, DOI: 10.1109/JPROC.2022.3149785
- J. Lee, K. Matsumura, K. Yamakoshi, P. Rolfe, S. Tanaka, T. Yamakoshi, “Comparison between red, green and blue light reflection photoplethysmography for heart rate monitoring during motion”, 2013 35th Annual International Conference of the IEEE Engineering in Medicine and Biology Society (EMBC): 1724-1727, 2013, DOI: 10.1109/EMBC.2013.6609852
- Y. C. Lin, Y. H. Lin, “A study of color illumination effect on the SNR of rPPG signals”, 2017 39th Annual International Conference of the IEEE Engineering in Medicine and Biology Society (EMBC): 4301-4304, 2017, DOI: 10.1109/EMBC.2017.8037807
- A. Toshev, C. Szegedy, “DeepPose: Human Pose Estimation via Deep Neural Networks”, 2014 IEEE Conference on Computer Vision and Pattern Recognition (CVPR): 1653-1660, 2014, DOI: 10.1109/CVPR.2014.214
- S. E. Wei, V. Ramakrishna, T. Kanade, Y. Sheikh, “Convolutional Pose Machines”, 2016 IEEE Conference on Computer Vision and Pattern Recognition (CVPR): 4724-4732, 2016, DOI: 10.1109/CVPR.2016.511
- Z. Cao, G. Hidalgo, T. Simon, S. E. Wei, Y. Sheikh, “OpenPose: Realtime Multi-Person 2D Pose Estimation Using Part Affinity Fields”, IEEE Transactions on Pattern Analysis and Machine Intelligence, 43(1): 172-186, 2021, DOI: 10.1109/TPAMI.2019.2929257
- V. Bazarevsky, I. Grishchenko, K. Raveendran, T. Zhu, F. Zhang, M. Grundmann, “BlazePose: On-device Real-time Body Pose tracking”, arXiv preprint arXiv:2006.10204, 2020, DOI: 10.48550/arXiv.2006.10204
- V. Bazarevsky, I. Grishchenko, “On-device, Real-time Body Pose Tracking with MediaPipe BlazePose”, Google Research Blog, 2020.
- A. G. Howard, M. Zhu, B. Chen, D. Kalenichenko, W. Wang, T. Weyand, M. Andreetto, H. Adam, “MobileNets: Efficient Convolutional Neural Networks for Mobile Vision Applications”, arXiv preprint arXiv:1704.04861, 2017, DOI: 10.48550/arXiv.1704.04861
- F. Taranum, S. F. Sayeedunnisa, G. R. Patil, M. Hijab, K. Sridevi, S. S. Ahmad, “Deep learning framework with optimizations for automatic detection of arrhythmia from ECG data”, Journal of Theoretical and Applied Information Technology, 103(7): 2825-2841, 2025.
- N. Gayapersad, S. Rocke, Z. Ramsaroop, A. Singh, C. Ramlal, “Beyond Blood Pressure and Heart Rate Monitoring: Towards a Device for Continuous Sensing and Automatic Feature Extraction of Cardiovascular Data”, 2016 8th International Conference on Computational Intelligence and Communication Networks (CICN): 261-265, 2016, DOI: 10.1109/CICN.2016.58
- Y. Cui, C. H. Fu, H. Hong, Y. Zhang, F. Shu, “Non-contact time varying heart rate monitoring in exercise by video camera”, 2015 International Conference on Wireless Communications & Signal Processing (WCSP): 1-5, 2015, DOI: 10.1109/WCSP.2015.7341278
- H. Lu, H. Han, S. K. Zhou, “Dual-GAN: Joint BVP and Noise Modeling for Remote Physiological Measurement”, 2021 IEEE/CVF Conference on Computer Vision and Pattern Recognition (CVPR): 12399-12408, 2021, DOI: 10.1109/CVPR46437.2021.01222
- C. Nadrag, V. Poenaru, G. Suciu, “Heart Rate Measurement Using Face Detection in Video”, 2018 International Conference on Communications (COMM): 131-134, 2018, DOI: 10.1109/ICComm.2018.8484779
- D. N. Tran, H. Lee, C. Kim, “A robust real time system for remote heart rate measurement via camera”, 2015 IEEE International Conference on Multimedia and Expo (ICME): 1-6, 2015, DOI: 10.1109/ICME.2015.7177484
- F. Xu, Q. W. Zhou, P. Wu, X. Chen, X. Yang, H. Yan, “Heart rate measurement based on face video sequence”, Medical Imaging 2015: Computer-Aided Diagnosis, 9414: 941435, 2015, DOI: 10.1117/12.2083315
- Q. Zhu, C. W. Wong, C. H. Fu, M. Wu, “Fitness heart rate measurement using face videos”, 2017 IEEE International Conference on Image Processing (ICIP): 2000-2004, 2017, DOI: 10.1109/ICIP.2017.8296632
- C. Cheuque, M. Querales, R. Leon, R. Salas, R. Torres, “An Efficient Multi-Level Convolutional Neural Network Approach for White Blood Cells Classification”, Diagnostics, 12(2): 248, 2022, DOI: 10.3390/diagnostics12020248
- P. Viola, M. Jones, “Rapid object detection using a boosted cascade of simple features”, Proceedings of the 2001 IEEE Computer Society Conference on Computer Vision and Pattern Recognition, 1: I-511-I-518, 2001, DOI: 10.1109/CVPR.2001.990517
- A. A. Fedotov, “Selection of Parameters of Bandpass Filtering of the ECG Signal for Heart Rhythm Monitoring Systems”, Biomedical Engineering, 50(2): 114-118, 2016, DOI: 10.1007/s10527-016-9600-8
- M. Z. Poh, D. J. McDuff, R. W. Picard, “Advancements in Noncontact, Multiparameter Physiological Measurements Using a Webcam”, IEEE Transactions on Biomedical Engineering, 58(1): 7-11, 2011, DOI: 10.1109/TBME.2010.2086456
- K. Li, H. Rudiger, T. Ziemssen, “Spectral Analysis of Heart Rate Variability: Time Window Matters”, Frontiers in Neurology, 10: 545, 2019, DOI: 10.3389/fneur.2019.00545