An Ensemble Learning Approach for Student Performance Analysis of a Higher Educational Institute using a SHAP-Based Feature Selection and Optuna Optimization


Adv. Sci. Technol. Eng. Syst. J. 11(2), 1–11 (2026);
 DOI: 10.25046/aj110201
Forecasting and assessing student performance are crucial for allowing educators to pinpoint deficiencies and promote grade improvement. A thorough comprehension of feature contributions is crucial for improving model interpretability and facilitating informed decision-making in academic institutions. Explainable artificial intelligence encompasses methodologies and strategies designed to deliver transparent and accessible rationales for the decisions rendered by artificial intelligence and machine learning algorithms. In this research paper, an interpretable gradient boosting approach for predicting student performance is introduced, including both feature selection using SHapley Additive exPlanations (SHAP)-based features and cost-sensitive decision thresholds. The proposed methodology includes hybrid resampling with SMOTE-Tomek, Optuna hyperparameter optimization with stratified cross-validation, and SHAP-guided feature selection strategy. The proposed approach is tested using a dataset of a higher educational institute in the Middle East, including student information, learning management, and a video interaction system, to make an analysis and evaluate the performance of the students. The results show both improvement of the macro F1-score and the fail-class recall by achieving an accuracy of 94%, a weighted/macro F1-score of 0.9399, and a fail-class recall of 0.9619. The suggested method facilitates trade-offs among prediction accuracy, interpretability, and fairness, bridging the divide between high-performing machine learning models and practical educational applications, hence aiding in the formulation of data-driven policies and the customization of learning experiences.
1. Introduction
As of 2026, artificial intelligence (AI) has outgrown its status as an experimental quack and become a key component of modern education [1]. It is a powerful force multiplier to teachers because it automated administrative processes like grading and scheduling and provided students with learning paths that are highly customized to their individual pace and style in real-time [2].
With the implementation of AI, the classroom will turn into an interactive environment in which the insights that are data-driven will determine gaps in learning before they grow, and AI-based co-pilots will tutor students round-the-clock [3]. To transform this technology into a beneficial rather than a distracting factor, it is necessary to focus on five core pillars by ensuring the schools have a robust digital infrastructure (high-speed connectivity and hardware), thorough artificial intelligence literacy training of staff and pupils, clear ethical standards that guarantee the privacy of data and academic integrity, fair access to prevent socioeconomic imbalance, and a firm dedication to the human touch that is at the heart of the learning process [4, 5, 6]. Education has been radically transformed with the introduction of agentic AI systems, moving beyond the integration of limited digital tools. In the modern scholarly environment, AI is not perceived as an additional tool anymore; instead, it is a backbone of Education 4.0. This increase is defined by the one-size-fits-all approach to massive individualization. AIs are also finding their way into schools as a way of dealing with the twin problems of teacher shortages and classroom diversity [7]. Clearing cognitive processes (diagnostic testing and paperwork) for intelligent systems, educational establishments are trying to recapture the human aspect of teaching. However, this rapid scaling has outpaced the standardization of implementation protocols, resulting in a fragmented environment where the effectiveness of artificial intelligence varies significantly across different socioeconomic contexts.
There are two different and yet not completely separate spheres that form the technical foundation of this educational revolution: machine learning and deep learning [8].
1.1. Machine Learning and Deep Learning
Machine learning (ML) is the key force behind the learning analytics. Researchers can use previous student data to identify patterns which are not visible to the human eye through supervised learning algorithms, such as random forests, support machines or gradient boosting. For instance,
- Early warning systems [9]: ML models are intended to accurately identify the students who are at risk of failure based on attendance, engagement metrics, and quiz scores.
- Adaptive sequencing [10]: In an unsupervised learning case, students are clustered together and the platforms is capable of dynamically updating the content difficulty on-the-fly.
ML concerns itself with the patterns, whereas deep learning (DL) concerns itself with the complexity of human interaction, including:
- Natural language processing [11]: Chatbots and virtual tutors based on the DL can provide more comprehensive feedback on open-ended essays and cease being based on multiple-choice evaluation.
- Computer vision [12]: Computer vision algorithms are now under study in physical or hybrid classrooms to both quantify student interest in the form of posture and eye-tracking and provide teachers with a heat map of classroom interest.
- Generative Architecture [13]: Using transformer-based architectures,educators can produce custom lesson plans and multi-sensory (text-to-video or text-to-image) content in a few seconds according to specific curriculum
Academic performance by students is one of the key measures of learning development, as it is influenced by such factors as gender, age, teaching staff, and learning conditions [14]. Academic
achievement is a field of interest in the field of education that has been investigated through forecasting. Prediction and evaluation of student performance play an essential role in helping teachers clarify the deficiencies and improve the grades. On the same note, students are able to enrich their learning activities, and administrators improve their operations [15]. The recent advancements in educational data mining and artificial intelligence have made it much more accurate to predict the performance of students in respect to their academic results [16]. The studies have explored various machine learning and deep learning techniques, such as clustering-based feature detection and optimization of the classifier, convolutional neural networks with ensemble learning, generative models with deep support vectors, behavioral modeling (processes), and stacked ensemble approaches to failure prediction [17]. Different machine learning and deep learning systems were studied, such as clustering-based feature identification and optimization of the classifier; convolutional neural networks with ensemble learning; generative models with deep support vectors; process-based behavioral modeling; and stacked ensemble methods of failure prediction. Despite the achievements, there remain significant gaps in methodology that require filling. However, few studies have compared the effect of different features on the performance of machine learning models regarding predicting student performance. The overall perspective of the contributions of features is important to enhance the interpretability of models and make informed decisions in academic institutions. Explainable AI (XAI) is a collection of techniques and practices intended to provide easy-to-understand explanations of AI and ML models’ decisions. An explainability layer can be added to these models, which allows building more reliable and open systems to support students and other educational stakeholders [18]. XAI has a couple of advantages in its implementation. It provides the decision-makers and stakeholders with a clear representation of the reasons that underlie the AI-driven decisions so that they are informed to make a decision. It is also useful in finding possible biases or limitations in the models, such as identifying skewed training data or algorithmic biases, and, as a result, provides more correct and equal results.
This paper presents a reliable, understandable, and data-driven framework that is both transparent and educational. The proposed approach will facilitate the informed academic decision making process, as well as early detection of at risk students, by combining the model interpretability and performance aware decision making strategies. On the whole, the article points out the value of predictive effectiveness, fairness, and explainability in using machine learning methods in education.
The remainder of this paper is organized as follows: Section 2 provides the background and related concepts of the study domain, Section 3 presents the proposed methodology in detail, and Section 4 reports and discusses the experimental results, followed by a results comparison with other methods. Finally, Section 5 concludes the paper and outlines future research directions.
2. Background
The utilization of AI-driven tools is rapidly changing the land-scape of the educational process, redefining the approaches to the construction of the teaching, learning, and evaluation processes.
These technologies help educators to experience personalized learning and adaptive feedback and make decisions based on data. With their increasing adoption, it is necessary to know their impact and quality on education. The necessity to enhance the rankings of universities and employability of the students has led to the adoption of data mining and AI in learning to give a more accurate prediction of academic success [19]. The author used K-means clustering to identify the important factors of performance in his study and com-pared many classifiers. His findings indicated that a tuned support vector machine was one of the best alternatives, with the highest prediction accuracy of 96%. Conversely, the Naive Bayes classifier had the lowest accuracy, which is due to the fact that it provided an assumption about the independence of the feature. The study established that hyperparameter optimization greatly optimized the performance of extrapolative models in educational data mining.
In [20], the authors have introduced a machine learning structure that utilizes features extracted using the convolutional neural network to predict student academic achievement through the use of the ”MOODLE” data. To overcome the imbalance of the population in the classes, the synthetic minority oversampling method was applied. The offered model had a classification accuracy of 99.9%. The variation in their approach was based on a combination of deep convoluted features and an additional tree classifier, which surpassed existing state-of-the-art methods.
In [21], the authors introduced a better model that integrated a conditional generative adversarial network and a deep support vector machine to predict the academic performance of students. The model overcame the limitations of small datasets by generating synthetic mockups and focused on features of home and school teaching. The findings showed that the integration of tutoring fac-tors achieved the best results. In addition, the multi-kernel deep SVM also outperformed the existing models across some of its key metrics, such as accuracy and processing time, demonstrating its effectiveness in handling diverse educational data.
The authors of [22] provided a process-based behavior categorization and prediction model that could be used to predict e-learning performance. The estimated methodological split the learner interactions through process-behavior classification model and combined the features through a behavior classification-based e-learning performance framework. The empirical findings of their research on the dataset of OULAD showed more advanced projecting accuracy compared to traditional ones.
The authors of the study [16] proposed a study, which combined cluster analysis, discriminant analysis, and convolutional neural networks to estimate and predict academic results so that the pos-sible errors of traditional approaches to the evaluation of students can be properly addressed. The innovative statistical metric was conducted to control the number of clusters in the K-means clustering in an accurate manner to enhance the consistency of prediction. The effectiveness of the proposed approach was determined with the help of model validation through the use of cross-validation methods.
A combination of an AI-based academic performance forecasting model enhanced collaborative online learning by using learning analytics, which was critical [23]. A quasi-experimental design was therefore designed to correlate student engagement, performance and satisfaction between supported and unsupported clusters. Findings indicated that the integrated model produced positive student engagement, improved learning, and satisfaction levels.
Furthermore, a stacked ensemble machine learning strategy, which combines the use of three models, namely, Random Forest, extreme gradient boosting (XGBoost), and feed-forward neural net-works, was estimated to predict university student failure [24]. The ensemble was found to be more accurate and have the highest AUC than single models, experienced on university data. The method enabled initial detection of the vulnerable students, which enabled one to intervene in time by the education people.
The authors of [25] designed an ML and XAI framework on student career counseling that analyzed academic and employability data to maintain career judgments. The White Box as well as the Black Box prototypes have been trained in an educational dataset in their study. The greatest performance in the tested models was achieved with the Naive Bayes when recall was used and the scores of the F-measure were 91.2% and 90.7%, respectively.
A research in [26] inspected the recognition of the effect of AI and social media within the academic performance and mental health of university students, enabled through smart learning. Using the data collected in the course of the surveys of 401 students in China, the findings were clear that both AI and social media are positively associated with academic achievement and psychological well-being. In addition, the study also found that smart learning strengthened these beneficial relations to a great extent. These results highlighted the fruitful nature of digital technologies in modern education in the form of smart learning methods.
Moreover, scholars also tend to embrace SHAP (SHapley Additive exPlanations), a game-theoretical model created in to offer an analytically sound method of describing individual forecasts [27]. SHAP allocates the payout (the prediction of the model) fairly among all the input features (e.g. the previous grades of a student, his or her socioeconomic status, or engagement measures) by the marginal contribution to the end result. In contrast to other global metrics of importance, SHAP provides both global interpretability (what factors contributed to the overall performance of the school) and local interpretability (why was a particular student named as being at risk). This two-fold power is the key to educational equity, as it will enable teachers to audit models and learn the logic of AI-based interventions in specific detail, thus building trust and responsibility in an online classroom [28].
2.1. Gaps and Motivations
Recent developments in educational data mining and artificial intelligence have significantly increased the accuracy of projecting the academic performance of students as discussed above. A number of studies have looked into different ML and DL approaches, including, but not limited to, clustering-based feature discovery, optimized classifiers [19], convolutional neural networks with ensemble learning [20], generative models with deep support vector machines [21], process-based behavioral modeling [22], and stacked ensemble classifiers in failure prediction [24]. Despite these contributions, some significant gaps in the methodology re-main that should still be addressed. Nonetheless, there still remain certain gaps in the latest studies, including:
- Researchers do not pay much attention to model explainability. The majority of the studies in this area focus on predictive performance measures, such as accuracy and AUC, yet they fail to indicate the influence of individual features on the model decision making. Even Guleria and Sood [25] proposed explainable AI methods in educational data mining; but they analyzed them primarily in terms of conventional classifiers and did not introduce explainability in high-performing ensemble architectures.
- Feature selection techniques can be heuristic or Earlier works are based on feature engineering, clustering, or deep feature extraction [19, 22, 16]. None of the studies examined applies SHAP values as a systematic selection feature of features, which might contribute to better generalization, reduce redundancy, and simplify the analysis of the results.
- Techniques of managing class imbalance are not discussed. Although techniques such as synthetic minority over-sampling technique (SMOTE) and conditional generative adversarial networks have been employed to construct synthetic data have been applied [20, 21], these techniques do not entirely remove bias in favor of the majority In the majority of studies, they apply set decision thresholds, which may render it extremely difficult to identify minority classes. This is particularly significant in the school environment where it is necessary to know at a quick time those students who are likely to fail or are failing in order to be able to assist them.
- Most of the evaluation methods are accuracy based. Reported accuracies can also mask poor performance on minor-ity classes, especially where there is an imbalanced Optimization goals are rarely used (such as metrics such as macro F1-score and the fail-class recall, which are more useful to predict educational risk), and threshold-aware vali-dation is generally absent.
To overcome these shortcomings, the present paper recommends an explainable gradient boosting model of SHAP-based feature selection and cost-sensitive decision thresholding. The proposed method includes hybrid resampling using SMOTE-Tomek, hyperparameter optimization using Optuna and stratified cross-validation, and a SHAP-based feature selection method. Additionally, there is a threshold optimization approach; which is precision-recall based to maximize the macro F1-score and improve fail-class recall. The given approach ensures the equilibrium of predictive performance, transparency, and practical educational information due to the combination of explainability and cost-aware decision-making into the learning pipeline, which contributes to the state of the art in student performance prediction.
3. Methodology
The proposed approach is presented in Algorithm 1, composed of five main steps: Data loading and preprocessing, feature enhancement and hybrid resampling strategy, hyper-parameter optimization via Optuna with stratified cross-validation, model training and SHAP-based feature selection, and model training, threshold-aware validation, testing and explainability.
Algorithm 1: An Explainable Gradient Boosting Algorithm with SHAP-Based Feature Selection and Cost-Sensitive Decision Thresholding
Result: Optimized XGBoost classifier, selected feature subset, optimal decision threshold, and validated performance metrics.
START

STEP 1: Data Loading and Preprocessing
    Load dataset D;
    Remove duplicates and missing values;
    Encode target labels y ∈ {0,1};
    Label-encode categorical features;
    Standardize numerical features;
    Split D into 70% stratified training and 30% testing sets;

STEP 2: Feature Enhancement and Hybrid Resampling Strategy
    Apply feature engineering on training and testing sets;
    Apply SMOTE–Tomek on training data;
    Obtain balanced dataset D_res;

STEP 3: Hyperparameter Optimization via Optuna with Stratified Cross-Validation
    Initialize Optuna study;

    while Optuna trial t ≤ T do
        Sample XGBoost hyperparameters;
        Initialize Stratified K-Fold cross-validation;

        for each fold k = 1 to K do
            Train XGBoost model on training fold;
            Predict labels on validation fold;
            Compute Macro F1-score;
        end

        Return mean Macro F1-score;
    end

    Select optimal hyperparameters θ*;

STEP 4: Model Training and SHAP-Based Feature Selection
    Train XGBoost model using θ* on D_res;
    Compute SHAP values for all features;
    Rank features by mean absolute SHAP importance;
    Select top M features;

    Predict class probabilities on holdout test set;
    Compute Precision–Recall curve;
    Determine optimal threshold τ* maximizing F1-score;

STEP 5: Model Training, Threshold-Aware Validation, Testing and Explainability
    Initialize Stratified K-Fold cross-validation;

    for each fold k = 1 to K do
        Train XGBoost on selected features;
        Predict probabilities;
        Apply threshold τ*;
        Compute Accuracy, Macro F1, and Recall;
    end

    Train final model on full resampled training set;
    Predict on holdout test set;

    Generate SHAP summary plot;
    Generate SHAP bar plot;

END
3.1. Data Loading and Preprocessing
After collecting data from different sources, a preprocessing step should be performed to clean and standardize the dataset. In this study, the data go through two steps of processing that consist of removing duplicate records and samples that contained missing values to achieve both data purity and model training bias protection.
The target variable, denoted as y, represents student performance results and should be encoded using a label encoder to give 1 for passed students and 0 for failed ones. The label encoding technique encodes the categorical labels (string labels) into numeric values, allowing ML algorithms to use them. The different categories of a feature are allocated different integers, and the uniqueness of the classes is maintained without suggesting any rank.
The feature set, called X, was divided into categorical and numerical features. Categorical features are transformed into numeric using the label encoding technique. However, the numerical features are standardized using z-score normalization that produced features with equal scales and better model training results [29]. The z-score normalization equation is given by:
\begin{equation}
x’=\frac{x-\mu}{\sigma}
\tag{1}
\end{equation}
Where x represents the original feature value, µ is the mean of the feature, σ represents the standard deviation of the feature, and x′ is the standardized feature value.
After that, the dataset goes through its last preparation stage by applying a 70/30 stratified split, which maintains the original class distribution between training and testing sets. The training set was used for model development, training, feature engineering, feature selection, and cross-validation. The testing set is employed later Boost model predicts the probability of class c for sample i as: for model performance evaluation.
3.2. Feature Enhancement and Hybrid Resampling Strategy
To enhance the predictive power of the model, feature engineering was performed on the training and test sets. In both cases, more numerical characteristics were calculated by taking the row-wise mean and standard deviation of the initial numerical characteristics. In addition, the interaction terms between the three number features that have the strongest relationship with the target variable were also generated to capture possible nonlinear relationships.
Formally, if x j and xk are two chosen numerical features; the interaction feature is the one that is determined as [30]:
\begin{equation}
y_{\text{interaction}} = y_j \times y_k
\tag{2}
\end{equation}
Once the feature engineering had been completed, a hybrid SMOTE-Tomek resampling strategy was employed to handle the class imbalance in the training set. The Synthetic Minority Over-sampling Technique (SMOTE) was used to create more samples of the minority class, and then Tomek links were post-removal to remove borderline majority samples. The result of this process was a balanced set of training, called D trainers, with a better modelization of the minority class of “Fails,” the future training of models becomes less biased.
3.3. Hyperparameter Optimization via Optuna with Stratified Cross-Validation
The XGBoost classifier is used in this study to train the model with a hyperparameter tuning step performed using the Optuna tool to reach the highest macro F1-score. XGBoost is a technique of ensemble learning, a subset of ML. It consists of constructing a set of trees, each tree correcting the mistakes of the former ones. It solves a regularized goal function that is a loss term and a complexity term to enhance predictive accuracy and avoid overfitting. Optuna is an automatic hyperparameter tuning tool that proves its efficiency in various applications. It searches for the best parameters based on techniques like the tree-structured Parzen estimator. Using cross-validation, Optuna can produce the hyperparameter
set θ∗ according to a user-specified objective, like the F1-score.
To manage possible over-fitting risks and to guarantee model
generalization, a number of validation strategies were incorporated into the suggested technique. First, in the hyper-parameter optimization, a stratified cross-validation with K folds was used so that the model would not be fit to a particular subset of training data and provide a more accurate estimate of the performance on the different cross-validation folds. Furthermore, the data was divided into 70/30 stratified train test split whereby the test was entirely concealed during the training and model selection. Furthermore, bias reduction is ensured solely through resampling (SMOTE-Tomek) applied to the training data only without information leakage into the test set.
3.4. Model Training and SHAP-Based Feature Selection
XGBoost is retrained based on τ∗ on the training set. Let Dres train= (Xi, yi)N represents the resampled training set. The XG-Boost model predicts the probability of class c for sample i as:
\begin{equation}
y_i^{c}=\operatorname{softmax}\!\left(\sum_{k=1}^{K} f_k(X_i)\right), \quad f_k \in F
\tag{3}
\end{equation}
where F denotes the space of regression trees, and K is the number of boosting iterations [31]. The final predicted class is obtained as:
\begin{equation}
\hat{y}_i = \arg\max_{i}\, y_i^{c}
\tag{4}
\end{equation}
To understand better the contributions of each feature, SHAP values were calculated for all features in Xres [32].
Formally, if x j and xk are two chosen numerical features; the inter-action feature is the one that is determined as [30]:
contribution of feature j to the model output. It is given by:
\begin{equation}
\hat{y}_i=\phi_0+\sum_{j=1}^{M}\phi_j\,y_{ij}
\tag{5}
\end{equation}
where ϕ0 is the expected model output and M is the total number of features. Features were ranked by the mean absolute SHAP value in all instances:
\begin{equation}
SHAP^{\text{mean}}_{j}
=
\frac{1}{N}
\sum_{i=1}^{N}
\left|\phi_{ij}\right|
\tag{6}
\end{equation}
The top M features with the highest mean SHAP values were selected for used later to retrained the XGBoost classifier while reducing dimensionality and conserving the most influential predictors. The number of selected features M is computed based on the ranking of mean absolute SHAP importance values to retain only the most influential variable contributing to the model output. After training, the model was applied to the holdout test set. To enhance the performance of the minority “Fail” class, the decision threshold τ∗ was optimized by maximizing the F1-score, using:
\begin{equation}
\tau^{*}
=
\arg\max_{\tau}
F1\text{-}score(\tau)
\tag{7}
\end{equation}
where F1-score is given later in this section. The final binary predictions were calculated by:
\begin{equation}
\hat{y}_i=
\begin{cases}
1, & \text{if } p_i^{*} > \tau^{*} \\
0, & \text{otherwise}
\end{cases}
\tag{8}
\end{equation}
This structure guarantees the maximum prediction accuracy
and interpretability, permitting the identification of the most in-fluential features while adapting the classification threshold for imbalanced classes.
3.5. Model Training, Threshold-Aware Validation, Testing, and Explainability
To assess the performance of the proposed model, a stratified K-fold cross-validation CV was conducted on the resampled training which indicates the capability of the model to identify the positive category. The F1-score is the harmonic average of the precision and the recall measures, which will give a balance between the two measures.
Averages of these metrics that are cross-validated provide a good estimate of expected performance on unseen data. After that, the holdout test set predictions were conducted to check the generalization abilities of the model. For Explainability, SHAP values were calculated on the test set in order to measure how much each Dres train, with the top M features provided by SHAP [33]. feature contributed to the model predictions. SHAP values quantify the contribution that each feature has towards the prediction of XGBoost was trained on the training partition in each fold (k = 1, etc., K) and applied to the classification probabilities of the validation partition. The minimized threshold (τ∗) and Equation (8) were used to convert the projected probabilities pˆi into binary class predictions. A binary classification problem can be defined in the form of a confusion matrix (CM) as shown in Table 1, where TP is true positives, TN is true negatives, FP is false positives, and FN is false negatives [34].
Table 1: Confusion Matrix
| Actual | Predicted | |
|---|---|---|
| Positive (1) | Negative (0) | |
| Positive (1) | TP | FN |
| Negative (0) | FP | TN |
From CM, the following metrics are calculated:
\begin{equation}
\text{Accuracy}
=
\frac{TP+TN}{TP+TN+FP+FN}
\tag{9}
\end{equation}
\begin{equation}
\text{Precision}
=
\frac{TP}{TP+FP}
\tag{10}
\end{equation}
\begin{equation}
\text{Recall}
=
\frac{TP}{TP+FN}
\tag{11}
\end{equation}
\begin{equation}
F1\text{-}score
=
2 \times
\frac{\text{Precision} \times \text{Recall}}
{\text{Precision} + \text{Recall}}
\tag{12}
\end{equation}
Accuracy defines the ratio of the rightly classified instances of all the instances and the overall correctness of the model. Precision is the ratio of the number of true positive instances among the total number of cases that are predicted to be positive, and this measures how well positive predictions are made. Recall (or sensitivity) is a display of the percentage of the real positive instances identified, which indicates the capability of the model to identify the positive category. The F1-score is the harmonic average of the precision and the recall measures, which will give a balance between the two measures.
Averages of these metrics that are cross-validated provide a good estimate of expected performance on unseen data. After that, the holdout test set predictions were conducted to check the generalization abilities of the model. For Explainability, SHAP values were calculated on the test set in order to measure how much each feature contributed to the model predictions. SHAP values quantify the contribution that each feature has towards the prediction of an instance with a positive or negative contribution. The values of the SHAP were visualized by creating summary and bar plots to demonstrate the most significant features and understand the decision-making process of the model and have interpretable pre-dictions both of the majority of the class, Pass, and the minority, Fail.
4. Results and Discussion
4.1. Dataset Description
The dataset used in this paper is collected from [35]. This dataset includes information from 326 students at Middle East College in Oman, gathered between Spring 2017 and Spring 2021. It gathers data from three different educational platforms, including Student Information System (SIS), Moodle, and eDify. The dataset encompasses 23 features, including CGPA, coursework scores time spent on Moodle on and off campus, and video engagement metrics like play, pause, and likes. All data were anonymous and standardized. Dataset features are illustrated in Table 2, where ’Result’ is the target variable.
Table 2: Features of the adopted dataset
| Feature | Description | Type |
|---|---|---|
| ModuleCode | Unique code identifying the academic module | Categorical (Nominal) |
| ModuleTitle | Official title of the academic module | Categorical (Nominal) |
| SessionName | Academic session or semester in which the module is offered | Categorical (Nominal) |
| ApplicantName | Anonymized identifier of the student | Categorical (Nominal) |
| CGPA | Cumulative Grade Point Average of the student prior to the module | Numerical (Continuous) |
| AttemptCount | Number of attempts taken by the student to pass the module | Numerical (Discrete) |
| RemoteStudent | Indicates whether the student is enrolled as a remote learner (Yes/No) | Categorical (Binary) |
| Probation | Indicates whether the student is on academic probation | Categorical (Binary) |
| HighRisk | Indicates whether the student is classified as high academic risk | Categorical (Binary) |
| TermExceeded | Indicates whether the student exceeded the expected program duration | Categorical (Binary) |
| AtRisk | Indicates prior failure in two or more modules | Categorical (Binary) |
| AtRiskSSC | Indicates whether the student is registered with the Student Success Center | Categorical (Binary) |
| OtherModules | Number of other modules taken by the student in the same semester | Numerical (Discrete) |
| PlagiarismHistory | Level or count of previous plagiarism-related incidents | Numerical (Discrete) |
| CW1 | Marks obtained in Coursework 1 | Numerical (Continuous) |
| CW2 | Marks obtained in Coursework 2 | Numerical (Continuous) |
| ESE | Marks obtained in the End-Semester Examination | Numerical (Continuous) |
| Online C | Time spent on Moodle activities within campus (minutes) | Numerical (Continuous) |
| Online O | Time spent on Moodle activities outside campus (minutes) | Numerical (Continuous) |
| Played | Number of times video learning content was played | Numerical (Discrete) |
| Paused | Number of times video playback was paused | Numerical (Discrete) |
| Likes | Number of likes given to video learning content | Numerical (Discrete) |
| Segment | Number of replayed or segmented video interactions | Numerical (Discrete) |
| Result | Final academic outcome of the module (Pass/Fail) | Categorical (Target Variable) |
4.2. Results
The performance of the proposed XGBoost-based approach based on hybrid resampling, SHAP-based feature selection, and threshold-based validation will be presented. First, the hyperparameter tuning step with Optuna led to the optimization of the XGBoost configuration balanced between learning capacity and regularization. The resulting model uses 500 estimators with a depth of 4 and a low learning rate (0.019), allowing the model to converge consistently without overfitting, as illustrated in Table 3.
The subsampling value further enhances the generalization. Additionally, the selected values of gamma and minimum child weight could limit the unnecessary growth of trees.
Table 3: XGBoost Hyper-parameters resulting from Optuna step
| Hyperparameter | Value |
|---|---|
| n estimators | 500 |
| max depth | 4 |
| learning rate | 0.0190 |
| subsample | 0.8716 |
| colsample bytree | 0.8325 |
| gamma | 0.6009 |
| min child weight | 2 |
To increase the minority-class detection, the precision-recall curve was used to optimize the decision threshold. The best value of the threshold τ in achieving failing students is 0.60. This threshold value is delivered from deep analysis of PR. Indeed, by increasing the threshold, the model shifts toward higher sensitivity for the “Fail” class, enhancing recall metric while maintaining balanced precision metric.
Table 4 illustrates the performance of the optimized model on the holdout test set.
Table 4: Performance metrics of the proposed approach
| Class | Precision | Recall | F1-score | Support |
|---|---|---|---|---|
| Fail (0) | 0.87 | 0.68 | 0.76 | 19 |
| Pass (1) | 0.93 | 0.97 | 0.95 | 79 |
| Macro Avg | 0.90 | 0.83 | 0.86 | 98 |
| Weighted Avg | 0.92 | 0.92 | 0.91 | 98 |
| Accuracy | — | — | 0.9184 | 98 |
The model attained a satisfactory accuracy of 91.84%. The macro F1-score of 0.86 means that both classes have shown an equal performance. Although the Pass class was forecasted with significant reliability, the Fail class was forecasted with a recall of 0.68, indicating the natural challenge of minority-class forecasting even with aggressive oversampling and threshold optimization.
To further measure robustness, threshold-dependent stratified 5-fold cross-validation was performed in Table 5 that shows a high level of performance in every fold with a high accuracy of over 89% and a 100% fail-class recall. Also, it summarizes the results with a mean accuracy of 94.00%, a mean macro F1-score of 0.9399, and a mean fail-class recall of 0.9619, validating the high and consistent minority-class detection.
Table 5: Stratified 5-Fold Cross-Validation Results and Mean Performance
| Fold | Metric | ||
|---|---|---|---|
| Accuracy | Macro F1-score | Fail-class Recall | |
| Fold 1 | 0.8955 | 0.8954 | 0.9355 |
| Fold 2 | 0.9701 | 0.9701 | 0.9688 |
| Fold 3 | 0.9403 | 0.9402 | 0.9375 |
| Fold 4 | 0.9242 | 0.9242 | 0.9677 |
| Fold 5 | 0.9697 | 0.9697 | 1.0000 |
| Mean | 0.9400 | 0.9399 | 0.9619 |
Accordingly, these findings show that the proposed framework has high predictive accuracy with a significantly higher Fail-class recall, which is an important factor in early academic risk identification. The consistency in the cross-validation folds validates the strength of the threshold-conscious and explainable learning approach.
4.3. Explainability SHAP Analysis
SHAP was used to examine the role of each feature in the predictions of the proposed XGBoost model to provide the transparency and interpretability of the suggested predictive framework. As shown in Figure 1, the SHAP summary bar plot ranks features by their mean absolute SHAP values, that is, by their overall average effect on the model output. It can be seen in the analysis that ’ESE’ is the most powerful characteristic, and this means that the performance of the final examination is the most powerful determinant in the decision-making process of the model. This fact aligns with the academic assessment systems in which the end-term tests play an important role in determining the overall results. The large value of SHAP in ’ESE’ proves that the model predictions are heavily informed by indicators that have an important academic meaning.
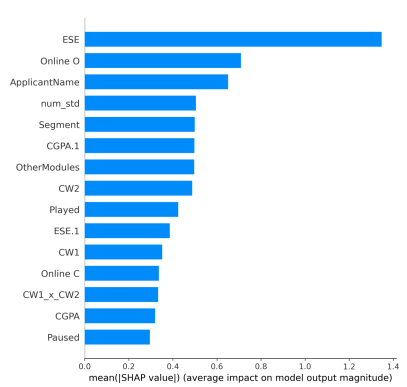
The variables of online engagement, specifically ’Online O’ (off-campus online activity), also show significant significance. This underlines the importance of prolonged learning activities beyond the classroom system and implies that vigorous interaction with the learning platforms is one of the main predictors of student success. These findings highlight the applicability of online learning behavior in the current educational analytics.
Coursework-related features (’CW1’ and ’CW2’) help improve the predictive power, which supports the significance of continuous assessment in the context of predicting the initial performance trends. In addition, the interaction feature (’CW1’ × ’CW2’) reveals that the interaction of the elements of coursework will give complementary information over the scores of both categories, and this proves the efficacy of feature interaction engineering. Video learning activities such as ’Played’, ’Paused’, and ’Segment’ are behavioral features with moderate and consistent effects. These characteristics mirror the consumption patterns and the level of engagement of students, which provide highly informative behavioral data that add to the traditional academic data. ’OtherModules’ as a feature and indicator of concurrent academic workload also adds to the interpretability of the model by reflecting the influence of course load performance. Built-in statistical characteristics like ’num mean’ and ’num std’ describe the trends and variability of academic performance on a global scale, which improves the capacity of the model to describe latent patterns in a model with many attributes.
It is noteworthy that ’ApplicantName’, even though it was anonymous and label-encoded, is one of the influential features. This shows an admitted weakness of the encoding of identifiers in tree-based models: that encoded representations can induce unwanted patterns. Although such an aspect enhances predictive accuracy, it is crucial to exercise caution in interpretability, which underscores the significance of responsible feature selection in explainable ML.
Figure 2 shows a global response of feature contributions to the predictive outcome, both regarding the importance of these contributions and the direction of the same.
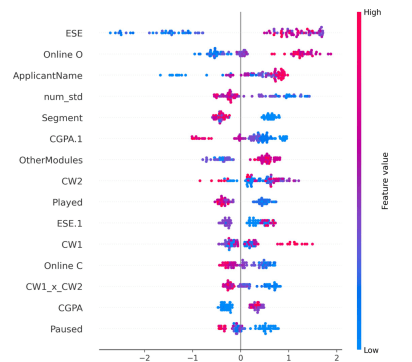
It shows that the End-Semester Evaluation – ’ESE’ – plays the greatest role in predicting the performance of students. The increase in ’ESE’ values results in increases in positive SHAP value, which implies a large contribution to desirable academic performance, and the decrease in ’ESE’ score significantly decreases the predicted performance. This observation is in line with the theory of educational assessment, where cumulative assessment includes the learning consistency and the acquisition of knowledge.
’Online O’, ’Played’, and ’Online C’ seem to have some con-siderable impact on engagement features as well. The beneficial impact on the model predictions of high levels of online communication and content interaction underlines the importance of online interaction in the contemporary learning settings. Conversely, characteristics relating to disengagement mechanisms (’Paused’ and increased variability in engagement ’num std’) have a negative impact, which indicates that disproportionate and/or discontinuous learning behaviors are linked to worse academic performance. The continuous assessment elements, such as ’CW1’, ’CW2’, and ’ Other Modules’, present strong positive contributions to their values in the case of high values. The interaction aspect ’CW1’ × ’CW2’ also illustrates that the balanced performance in the coursework assessments is synergistic in nature, and hence the value of long-term academic performance over short-term performance. The findings support the argument that the model successfully identifies the nonlinear associations between assessment elements.
Variables in student profiling – ’Segment’ – have mixed SHAP, which implies that there is heterogeneity in student learning patterns across different groups. This result justifies the necessity of individual learning interventions and accommodating academic support systems. Interestingly, although ’CGPA.1’ is historically a very powerful predictor, its impact is relatively weak, implying that historical academic performance is not as effective as the impact may have in the situations when more behavioral and assessment data is present. The fact that ’ApplicantName’ is one of the crucial features indicates the existence of latent institutional records or structural or contextual information. Although this can enhance predictive accuracy, it also introduces both ethical and fairness concerns, which underscores the need to be cautious about which features are introduced and who controls education AI systems. In case with the prediction regarding the performance of students, names can be used as the proxies of the sensitive variables such as ethnicity, gender, or regionality. To make the research and testing efficient, the ’ApplicantName’ field was retained to evaluate and learn more about how the model is sensitive to such possible biases. Therefore, the measures of fairness can be evaluated to ensure that the algorithm can be deployed as an instrument of equitable educational assistance.
The explainability analysis with the use of SHAP proves that the suggested model is based on academic and behaviorally relevant characteristics mainly, which makes the prediction readable and consistent with the knowledge in the educational domain. SHAP is able to offer global feature importance as well as transparent rationale of predictions, increasing the confidence in the model and facilitating its use in educational decision-support systems, especially to provide early warning of at-risk learners.
4.5. Comparison and Discussion
Table 6 shows a comparison between the proposed approach and existing systems for the proposed method (PM) in this study vs. other methods: random forest (RF), extra trees (ET), gradient boosting (GB), gaussian Na¨ıve Bayes (GNB), stochastic gradient descent (SGD), and logistic regression (LR). As illustrated, the proposed explainable gradient boosting model has the best performance in all the evaluation metrics with an accuracy of 94%, a weighted macro F1-score of 0.9399, and a fail-class recall of 0.9619, which are better than all the baseline models.
Table 6 also illustrates the 95% confidence intervals (CI) de-livered by all ML models to provide an estimate of the variability of models’ performance for the dataset. The proposed method achieves very narrow CI values, indicating stable and consistent predictive performance. This small CI confirms the robustness and generalization capability of the proposed framework compared with the other ML methods.
The more conventional ensemble approaches (RF, ET, GB) are equally competitive but with much lower fail-class recall, suggesting that they are not as sensitive to at risk students. Four main reasons may be associated with the better performance of the pro-posed approach, namely:
- XGBoostoptimized with Optuna that is capable of capturing nonlinear interactions between features;
- a SMOTE-Tomek hybrid resampling mechanism that controls class imbalance;
- SHAP-basedfeature selection, which leads to efficient generalization;
- optimization of the decision threshold by costs, which focuses on the detection of the fail class.
Combining these elements allows predicting student performance accurately, balancing it, and explaining the results, which is why the proposed approach can be highly effective when applied to early warning and academic decision-support systems.
In addition to the performance benefits, the given framework has high applicability to the educational decision-making process. The high fail-class recall means that most of the students at risk are properly identified, and this is essential in timely academic interventions and early warning systems. Furthermore, integration of SHAP-based explainability enables educators and administrators to know why a student is predicted to fail, allowing them to support him/her in specific ways and not in general ways.
The proposed method allows trade-offs between predictive accuracy, interpretability, and fairness to fill the gap between high-performing machine learning models and real-world educational application, helping to formulate data-driven policies and the personalization of learning journeys. This method requires approximately 14.5 million operations to learn 333 samples each with 37 features with 392 trees of maximum depth 3, which demonstrates its efficiency in computing with this sized dataset. Such findings supported the fact that the suggested model could deliver high predictive performance and be scaled-up and implemented on regular educational data. Besides, the implementation of the model requires approximately 0.54 seconds, which is very computationally efficient. Therefore, it is the right solution, which is scalable and applicable in real-time or near-real-time applications in education.
Table 6: Performance Comparison of the proposed approach and existing systems, where PM – Proposed Model; RF – Random Forest; ETC – Extra Trees Classifier; GBM – Gradient Boosting Machine; GNB – Gaussian Na¨ıve Bayes; SGD – Stochastic Gradient Descent classifier; LR – Logistic Regression.
| Method | Metric | ||
|---|---|---|---|
| Accuracy (Mean ± CI) | Macro F1-score (Mean ± CI) | Fail-class Recall (Mean ± CI) | |
| PM | 0.9400 ± 0.025 | 0.9399 ± 0.025 | 0.9619 ± 0.021 |
| RF | 0.9050 ± 0.030 | 0.9100 ± 0.028 | 0.8800 ± 0.035 |
| ETC | 0.8990 ± 0.031 | 0.9000 ± 0.030 | 0.8800 ± 0.034 |
| GBM | 0.8990 ± 0.032 | 0.9000 ± 0.031 | 0.8700 ± 0.036 |
| GNB | 0.7350 ± 0.041 | 0.7400 ± 0.040 | 0.7300 ± 0.043 |
| SGD | 0.6910 ± 0.045 | 0.6900 ± 0.046 | 0.6000 ± 0.050 |
| LR | 0.6720 ± 0.047 | 0.6700 ± 0.048 | 0.6700 ± 0.046 |
5. Conclusions
Forecasting and evaluating the performances of the students is a process that is necessary since it helps the teachers to realize the areas they have weaknesses and motivate their students to work hard to elevate their grades. In the context of making the models more interpretable and simplifying the process of academic institutions making knowledgeable decisions, the full picture of the contributions made by features is a must. XAI is used to refer to a collection of methods and strategies that are aimed at offering rationales that are both clear and easily available to the judgments that are made by the machine learning algorithms and artificial intelligence. In this research study, a gradient boosting strategy that is interpretable is introduced with the aim of predicting the performance of students. The strategy integrates the feature selection by using SHAP-based features, as well as the decision thresholds that are sensitive to the possible costs. The methodology that has been proposed includes hybrid resampling using SMOTE-Tomek, Optuna-hyperparameter optimization using stratified cross-validation, and SHAP-guided feature selection method. The proposed approach is tested with the help of a dataset of a higher educational establishment, a situated area in the Middle East. This data includes data about students, learning management, as well as a video interaction system. This testing is meant to carry out an analysis and test the performance of the students. Due to the achievement of the accuracy of 94%, the weighted/macro F1-score of 0.9399, and the fail-class recall of 0.9619, the results indicate that the macro F1-score and the fail-class recall have improved. Due to the fact that the proposed approach allows establishing trade-offs between the prediction accuracy, interpretability, and fairness, it allows closing the gap between machine learning models with high performance and practical educational outcomes. Consequently, it assists in the development of data-based policies and the personalization of learning. Although the proposed ap-proach demonstrates high predictive capability, the sample size is not large; as well as the dataset only covers one higher education institution in the Middle East region. This weakness may influence the externalization of the results. Thus, prospective research must be conducted in larger and more varied datasets to test the model on the dissimilar institutional contexts and remove the possible bias, which the current dataset can have.
- C. Koukaras, S. G. Stavrinides, E. Hatzikraniotis, M. Mitsiaki, P. Koukaras, C. Tjortjis, “Navigating the future of education: A review on telecommunications and AI technologies, ethical implications, and equity challenges,” Telecom, 7(2), MDPI, 2026, https://doi.org/10.3390/telecom7010002.
- P. Naayini, “AI and the future of education: Advancing personalized learning and intelligent tutoring systems,” Frontiers in Educational Innovation and Research, 1(1), 29–39, 2025, https://doi.org/10.62762/FEIR.2025.332098.
- S. Arora, A. Rajesh, R. Misra, G. Singh, “Bridging technology and trust: the role of AI-driven robo-advisors in middle-class financial management,” Management Decision, 1–24, 2025, https://doi.org/10.1108/MD-01-2025-0093.
- T. Heafner, D. Maxwell, “CIVIC: Five pillars for using artificial intelligence in social studies education,” Society for Information Technology & Teacher Education International Conference, 2581–2589, AACE, 2025.
- R. Daher, “Integrating AI literacy into teacher education: a critical perspective paper,” Discover Artificial Intelligence, 5(1), 217, 2025, https://doi.org/10.1007/s44163-025-00475-7.
- G. Nassreddine, L. Saleh, M. Al Majzoub, A. El Arid, “SHAP explainability: An ensemble learning approach for student performance prediction,” 2025 IEEE International Conference on Industry 4.0, Artificial Intelligence, and Communications Technology (IAICT), 432–438, IEEE, 2025, https://doi.org/10.1109/IAICT65714.2025.11100707.
- Y. Luo, G. Zhou, Y. Cui, “Understanding generative artificial intelligence adoption in higher education faculty: evidence from Chinese Universities and technical and vocational colleges,” Education and Information Technologies, 1–41, 2026, https://doi.org/10.1007/s10639-025-13885-y.
- S. Sengupta, S. Chakrabarti, “Towards a smarter education system: an investigation into ML and DL for information retrieval,” Multimedia Tools and Applications, 1–34, 2025, https://doi.org/10.1007/s11042-025-20656-x.
- W. Cao, N. Mai, “Predictive analytics for student success: AI-driven early warning systems and intervention strategies for educational risk management,” Educational Research and Human Development, 2(2), 36–48, 2025.
- I. Gligorea, M. Cioca, R. Oancea, A.-T. Gorski, H. Gorski, P. Tudorache, “Adaptive learning using artificial intelligence in e-learning: A literature review,” Education Sciences, 13(12), 1216, 2023, https://doi.org/10.3390/educsci13121216.
- Hariyanto, F. X. D. Kristianingsih, R. Maharani, “Artificial intelligence in adaptive education: a systematic review of techniques for personalized learning,” Discover Education, 4(1), 458, 2025, https://doi.org/10.1007/s44217-025-00908-6.
- S. Rawat, M. Rodrigues, P. Sheregar, K. A. Wagaskar, A. K. Tripathy, “Computer vision based hybrid classroom attention monitoring,” 2024 IEEE International Conference on Information Technology, Electronics and Intelligent Communication Systems (ICITEICS), 1–6, IEEE, 2024, https://doi.org/10.1109/ICITEICS61368.2024.10624965.
- G. Zhang, “Transformer-based AI framework for optimising English teaching evaluation strategies: a data-driven and explainable approach,” International Journal of Information and Communication Technology, 26(9), 107–127, 2025, https://doi.org/10.1504/IJICT.2025.145828.
- G. Gokmen, T. C. Akinci, M. Tektas, N. Onat, G. Kocyigit, N. Tektas, “Evaluation of student performance in laboratory applications using fuzzy logic,” Procedia-Social and Behavioral Sciences, 2(2), 902–909, 2010, https://doi.org/10.1016/j.sbspro.2010.03.124.
- Y. A. Alsariera, Y. Baashar, G. Alkawsi, A. Mustafa, A. A. Alkahtani, N. Ali, “Assessment and evaluation of different machine learning algorithms for predicting student performance,” Computational Intelligence and Neuroscience, 2022(1), 4151487, 2022, https://doi.org/10.1155/2022/4151487.
- G. Feng, M. Fan, Y. Chen, “Analysis and prediction of students’ academic performance based on educational data mining,” IEEE Access, 10, 19558–19571, 2022, https://doi.org/10.1109/ACCESS.2022.3151652.
- M. Abdasalam, A. Alzubi, K. Iyiola, “Student grade prediction for effective learning approaches using the optimized ensemble deep neural network,” Education and Information Technologies, 30(8), 10159–10183, 2025, https://doi.org/10.1007/s10639-024-13224-7.
- R. Dwivedi, D. Dave, H. Naik, S. Singhal, R. Omer, P. Patel, B. Qian, Z. Wen, T. Shah, G. Morgan, R. Ranjan, “Explainable AI (XAI): Core ideas, techniques, and solutions,” ACM Computing Surveys, 55(9), 2023, https://doi.org/10.1145/3561048.
- E. Ahmed, “Student performance prediction using machine learning algorithms,” Applied Computational Intelligence and Soft Computing, 2024(1), 4067721, 2024, https://doi.org/10.1155/2024/4067721.
- N. Abuzinadah, M. Umer, A. Ishaq, A. Al Hejaili, S. Alsubai, A. Eshmawi, A. Mohamed, I. Ashraf, “Role of convolutional features and machine learning for predicting student academic performance from MOODLE data,” PLOS ONE, 18(11), e0293061, 2023, https://doi.org/10.1371/journal.pone.0293061.
- S. Sarwat, N. Ullah, S. Sadiq, R. Saleem, M. Umer, A. Eshmawi, A. Mohamed, I. Ashraf, “Predicting students’ academic performance with conditional generative adversarial network and deep SVM,” Sensors, 22(13), 4834, 2022, https://doi.org/10.3390/s22134834.
- F. Qiu, G. Zhang, X. Sheng, L. Jiang, L. Zhu, Q. Xiang, B. Jiang, P.-K. Chen, “Predicting students’ performance in e-learning using learning process and behaviour data,” Scientific Reports, 12(1), 453, 2022, https://doi.org/10.1038/s41598-021-03867-8.
- F. Ouyang, M. Wu, L. Zheng, L. Zhang, P. Jiao, “Integration of artificial intelligence performance prediction and learning analytics to improve student learning in online engineering course,” International Journal of Educational Technology in Higher Education, 20(1), 4, 2023.
- J. Niyogisubizo, L. Liao, E. Nziyumva, E. Murwanashyaka, P. C. Nshimyumukiza, “Predicting student’s dropout in university classes using two-layer ensemble machine learning approach: A novel stacked generalization,” Computers and Education: Artificial Intelligence, 3, 100066, 2022, https://doi.org/10.1016/j.caeai.2022.100066.
- P. Guleria, M. Sood, “Explainable AI and machine learning: performance evaluation and explainability of classifiers on educational data mining inspired career counseling,” Education and Information Technologies, 28(1), 1081–1116, 2023, https://doi.org/10.1007/s10639-022-11221-2.
- M. F. Shahzad, S. Xu, W. M. Lim, X. Yang, Q. R. Khan, “Artificial intelligence and social media on academic performance and mental well-being: Student perceptions of positive impact in the age of smart learning,” Heliyon, 10(8), 2024, https://doi.org/10.1016/j.heliyon.2024.e29523.
- S. M. Lundberg, S.-I. Lee, “A unified approach to interpreting model predictions,” Advances in Neural Information Processing Systems, 30, Curran Associates, Inc., 2017.
- S. R. Rebeka, R. Thomas, “Fostering engagement and trust in e-learning communities through social media platforms,” in Innovative Approaches to Social Media in Education, chapter 11, 241–255, IGI Global, 2025, https://doi.org/10.4018/979-8-3693-3868-1.ch011.
- P. Muthulakshmi, M. Parveen, “Z-score normalized feature selection and iterative African buffalo optimization for effective heart disease prediction,” International Journal of Intelligent Engineering & Systems, 16(1), 2023.
- T. Yin, H. Chen, Z. Yuan, J. Wan, K. Liu, S.-J. Horng, T. Li, “A robust multi-label feature selection approach based on graph structure considering fuzzy dependency and feature interaction,” IEEE Transactions on Fuzzy Systems, 31(12), 4516–4528, 2023, https://doi.org/10.1109/TFUZZ.2023.3287193.
- I. L. Cherif, A. Kortebi, “On using extreme gradient boosting (XGBoost) machine learning algorithm for home network traffic classification,” 2019 Wireless Days (WD), 1–6, 2019, https://doi.org/10.1109/WD.2019.8734193.
- H. Wang, Q. Liang, J. T. Hancock, T. M. Khoshgoftaar, “Feature selection strategies: a comparative analysis of SHAP-value and importance-based methods,” Journal of Big Data, 11(1), 44, 2024, https://doi.org/10.1186/s40537-024-00905-w.
- G. Nassreddine, A. El Arid, M. Nassereddine, O. Al Khatib, “Fault detection and classification for photovoltaic panel system using machine learning techniques,” Applied AI Letters, 6(2), e115, 2025, https://doi.org/10.1002/ail2.115.
- G. Nassreddine, A. El Arid, M. Nasseredine, “Solar PV power prediction system based on machine learning approach,” 2023 IEEE International Conference on Energy Technologies for Future Grids (ETFG), 1–7, 2023, https://doi.org/10.1109/ETFG55873.2023.10407291.
- R. Hasan, S. Palaniappan, S. Mahmood, A. Abbas, K. U. Sarker, “Dataset of students’ performance using student information system, Moodle and the mobile application ‘eDify’,” Data, 6(11), 2021, https://doi.org/10.3390/data6110110.