Introducing a Stress Management and Navigation System for Blind Individuals

Adv. Sci. Technol. Eng. Syst. J. 10(2), 12–27 (2025);
 DOI: 10.25046/aj100202
The most challenging task in daily life of blind individuals is navigating outdoors. In this context, we are introducing and describing a navigation system that will provide two important tasks for blind individuals. Initially, the system will suggest the least stressful route for the blind to navigate among the various possible paths between a starting point and a destination. Finally, the system will provide real-time navigation guidance and real-time obstacle detection. The process to identify the less stressful route begins with the identification of all possible routes then calculating the Index of Difficulty for each Route (IDR), afterwads calculating the index of stress (ISR) based on the IDR for each route, eventually the route with lowest ISR is selected as the least stressful.
1. Introduction
Walking is a common and important mode of transportation for all individuals, but it can present challenges for those who are blind. While it may be a simple task for healthy individuals with normal vision to navigate from one point to another, blind individuals may experience difficulty, stress, and challenges in doing so. In previous studies we have identified a correlation between obstacles along a path and the level of stress experienced by blind individuals navigating that path [1]. Specifically, blind individuals navigating a road with many obstacles may experience higher levels of stress than those navigating a less obstructed road. Therefore, and since blind individuals lack visibility and cannot avoid obstacles encountered in their paths which can lead to harmful injuries, and since they cannot choose the right, less obstructed and stressful road, we are proposing a stress manipulating and navigation system to assist blind individuals in navigating more safely and managing stress. At an initial phase the proposed system will identify the least stressful route for the blind individual to travel on.
To identify the least stressful route the system will generate an index of difficulty and an index of stress for each possible route between start and destination points. By index we mean a numerical value. On the one hand the road difficulty index is a value that primarily depends on parameters specific to the road. On the other hand, the road stress index is a value that primarily depends on the index difficulty of the road among blind person specific parameters.
After identifying the least stressful route to travel on, the system will be navigating the blind individual in real time. This task will be achieved by detecting obstacles in real time using image processing techniques based on deep learning, and using voice feedback in a mobile application to alert the user to obstacles encountered and direct them along the entire path. In future work, the results of the system will be evaluated by comparing stress indices for blind users in the case of round trips or navigation on the same path or route more than once. Stress information collected during navigation by sensors integrated into the smart cane will provide feedback on a blind person’s navigation experience. This feedback will enable further personalization of the road stress index for a blind person.
The remainder of the paper is organized as follows. First, Section 2 presents obstacles classification and properties. Then a state- of-the-art survey on navigation and guidance systems for blind people is made in Section 3. The concept of the proposed navigation system is introduced in Section 4, while the road difficulty index is described in Section 5. Some simulation results on the identification of the least stressful route are presented in Section 6. The penultimate Section 7 discusses the implementation of the proposal into a real navigation system and more particularly its two main steps: identifying the less stressful route and real-time navigation. In section 8, we are evaluating the navigation system Finally, Section 9 concludes the paper.
2. State of art for navigation and guidance system for blind people
Statistics published by the World Health Organization (WHO) have revealed that one-sixth of the world population is visually impaired, and that figure is sharply increasing. Assisting blind individuals in traveling was and still is an important research area. Different approaches, technologies and navigation tools developed or used for the blind individuals will be listed in this section. The different technologies and approaches that will be listed were grouped into 5 categories: Localization technologies, Obstacles Recognition methods, Feedback methods, Devices, and Software-based systems.
2.1. Localization technologies
Below we are listing some Triangulation localization techniques using different technologies and hardware.
Triangulation using GPS-based System: The Global Positioning System (GPS), using satellites, is mainly used for outdoor navigation. The GPS receiver determines its distance from several satellites, using data from the ephemeris that employs the triangulation principle by which the time the data are sent is compared to the time it is received. This method requires the GPS receiver to be well exposed to the satellite, which prevents indoor locations. GPS systems are widely used for outdoor navigation [2]. The main disadvantage of GPS localization is that the GPS signal strongly degrades inside buildings, between tall buildings, or in dense forest areas such as parks [3].
Triangulation using the ZigBee-based System: ZigBee [4] is a wireless navigation that can be used in indoor/outdoor navigation systems. It offers high location accuracy, wide coverage, simple infrastructure, low cost, fast real-time navigation and low power consumption. ZigBee Triangulation is based on IEEE 802.15.4, which uses the 868 MHz band in Europe, the 915 MHz band in North America, and the 2.4 GHz band [5].
Triangulation using a Bluetooth-based System: Such systems are based on the Bluetooth Triangulation [6] method, as it is an easy method already deployed in mobile phones, cameras, handheld devices, and gadgets that can be connected over a shorter distance. It is low cost, has a reduced weight and reduced size, and provides power savings. A limitation of the system is that bluetooth can only communicate over a short distance and is thus not usable for long distance communication.
Triangulation using a Wi-Fi-based System: A Wi-Fi-based navigation system [7] enables device connection anytime, anywhere, at home, work. Moreover, it is compatible with a wide variety of different systems. Wi-Fi has advantages over other communication systems, but still has its limits: high power consumption and it takes some time to establish a connection. For example, the authors in
[8] presented a system for locating nurses, doctors or other patients within a hospital. The system can also be used to locate blind individuals. In [9], Wi-Fi triangulation has been used to help blind people get around in places close to their position.
2.2. Obstacles Recognition Methods
In the following, we list the different methods of obstacle recognition. Obstacles can be detected and recognized using different technologies like camera image, video processing or using sensors. Camera-based Image Processing Navigation System: This system uses a camera to identify and detect mobile and static obstacles. It can identify obstacles and nearby objects in real-time. While this system has a lot of advantages, it has some limitations: high processing and power consumption [10]. In [11], the authors explained how cutting-edge machine vision methodologies offer tools to assist with basic human needs such as psychological capacity, individual movement, and activities of daily living. In [12], the system uses pre-stored images of the floor to guide people. This system finds the obstacle-free route by comparing current floor images with pre-stored images and checking for introduced obstacles.
Ultrasonic Sensor-based Navigation Systems for Blinds: Systems like these are based on “ultrasound waves”. An ultrasonic transmitter will transmit an ultrasonic wave that will be reflected by any object or obstacle. The time of arrival of the wave added to the time reflected will identify the distance between the transmitter and the reflector. The drawback of this technology is the “short communication range”, and the inclusion of sight light among obstacles and sensors is considered essential [13].
Speech-to-Text-based Navigation System: These systems let blind individuals translate vocal or spoken language into text. These systems use a variety of computational devices. The speech to text technology is also known as automatic speech recognition.
Text-to-Speech-based Navigation System: These systems render texts from documents or images into speech [14].
2.3. Feedback Methods
Below we are listing some methods that provide feedback to the user and warning of nearby obstacles.
Haptic Feedback: A cane called WeWalk uses haptic feedback and ultrasonic sensors to let blind individuals scan their surroundings in [15]. In [16], a cane uses light and ultrasonic sensors to scan surroundings and uses audio and haptic feedback/vibration to warn the user of nearby obstacles. In [17], the author presented a technology to assist the visually impaired (VI) person that uses haptic feedback. This unit detects obstacles above the knee via ultra- sonic sensors. In [18], the author presented another technology for VI persons that uses haptic feedback/vibration to warn the VI per- son of the obstacle. In [19], the author introduced another method based on the conduction feedback. The smart cane can detect the obstacles and faces of friends and family members within 10 m. A bluetooth earpiece based on bone conduction is used to convey information about the obstacles. Haptic feedback can be divided into three categories: vibrotactile, shape-changing, and kinesthetic feedback.
2.4. Devices
In this section we are listing some devices that can help users navigate safely. Some of these devices provide directions for the users when navigating.
Braille Signs Tools: These tools can simplify the route for visually impaired, but they cannot serve as routing tools [20]. These days, numerous public regions, such as emergency clinics, railroad stations, instructive structures, entryways, lifts, and so on, are outfit- ted with Braille signs. These tools can help the visually impaired persons identify their area, but they cannot help them find their way. Smart Cane Tools: Smart canes help blind individuals to scan their surroundings and detect nearby obstacles. In [21], a smart cane detects obstacles and alerts the blind individuals by voice using a microphone that produces sounds. For indoor usage, an innovative cane navigation system was proposed [22] that uses IoT and cloud networks. Camera, microcontrollers, and accelerometers send audio messages. A cloud service is exploited in the navigation system to assist the user in navigating from one point to another. The system was seen to be very efficient in detecting hurdles and suggesting the shortest and fastest routes to the visually impaired via a cloud-based approach.
Voice-Operated Tools: This outdoor voice-operated navigation system is based on G.P.S., ultrasonic sensors, and voice. This outdoor navigation system provides alerts for the current position of the users and guidance for traveling. The problem with this system is that it failed in obstacle detection and warning alerts [23]. Another navigation system uses a microcontroller to detect the obstacles and a feedback system that alerts the users about obstacles through voice and vibration [24].
RFID-Based Map-Reading Tools: RFID is a wireless technology that can assist and help blind individuals to navigate indoor and outdoor. Short communication range for RFID is one of the primary limitations. In [25] an indoor navigation system for blind and older adults was proposed, based on the RFID technique, to assist disabled people by offering and enabling self-navigation in indoor surroundings. The goal of creating this approach was to handle and manage interior navigation challenges while taking into consideration the accuracy and dynamics of various environments. The system was composed of two modules for navigation and localization—that is, a server and a wearable module containing a microcontroller, ultrasonic sensor, RFID, Wi-Fi module, and voice control module. The results showed 99% accuracy in experiments. The time the system takes to locate the obstacle is 0.6 s. Another map-reading system based on RFID provides solutions for visually disabled persons to pass through public places using an RFID tag grid, a bluetooth interface, a RFID cane reader, and a personal digital assistant [26]. Unfortunately, this system is costly and there is a chance of collision in heavy traffic. A map-reading system is relatively expensive because of the hardware units it includes, and its limitation is that it is unreliable for areas with heavy traffic. Another navigation system based on passive RFID, proposed in [27], is equipped with a digital compass to assist the visually impaired. The RFID transponders are mounted on the floor, as tactile paving, to build RFID networks. Localization and positioning are equipped with a digital compass, and the guiding directions are given using voice commands.
2.5. Software-based systems
In the following we are listing some software-based systems that help blind users to navigate safely and provide directions while navigating. Some of these softwares can also detect obstacles.
Visually impaired individuals utilize a variety of tactile tools, such as raised point maps, small-scale prototypes, and magnet boards, following orientation and mobility (O&M) training. While these multimodal maps have been proposed to assist in navigation for the blind and visually impaired, they do have limitations, including the inability to update their content. To address these limitations, accessible interactive maps have been developed as a solution [28]. In one instance, the authors of [29] employed a participatory design approach to create an augmented reality map specifically for O&M classes. This prototype incorporates projection, audio output, and the use of tactile tokens, enabling visually impaired individuals to both explore and construct maps. Another innovative approach is the SmartTactMaps introduced by [30], which leverages smartphones to assist blind individuals in exploring tactile maps. Additionally, [31] presented a 3D environmental map generated using an RGB-D sensor, capable of extracting semantic information from RGB images to aid visually impaired individuals in navigating their homes. Furthermore, a 3D Printed audiovisual tactile map named LucentMaps was proposed for the visually impaired in [32]. It aimed to simplify the integration of mobile devices with physical tactile maps. Lastly, the VizMap system [33] utilizes computer vision and crowdsourcing to gather diverse information from indoor environments. It employs on-site sighted volunteers to capture various videos, which are then semantically labeled and embedded into a reconstructed 3D model. This model serves as a queryable spatial representation of the environment.
Smartphone-based navigation solutions offer users the advantages of portability and convenience. In the end of this section we outline the various solutions introduced on the smartphone platform to assist visually impaired individuals.
NavCog3, introduced by [34], represents an indoor navigation system designed to provide turn-by-turn instructions and immediate feedback in cases of incorrect orientation. Additionally, it offers information about landmarks and some nearby points of interest. The system communicates with users through audio feedback. An- other innovative approach by [35] is the PERCEPT-II application, where users receive navigation instructions to their selected destination by touching specific landmarks displayed on the mobile device. These destination spots are equipped with Near Field Communication (NFC) tags. However, it’s worth noting that this system has a limitation concerning the need to install and maintain a substantial number of NFC tags.
In [36], the authors introduced a smartphone application de- signed to be integrated with an image recognition system, creating an assisted navigation system. Depending on network availability, the system can operate in two modes: online and offline. Upon initiation, the smartphone captures an image and transmits it to a server for processing. Deep learning algorithms [37][38] on the server are then employed to identify various obstacles. Notably, the system faces significant limitations in terms of high energy consumption and the requirement for a high-speed network connection.
The TARSIUS system, as outlined in [39], aimed to enhance users’ comprehension of outdoor environments. Its components include the TARSIUS mobile app, a web server, a remote assistance centre, and bluetooth LE/iBeacon tags placed at points of interest along the streets. However, the primary challenges with the TARSIUS system involve the cost and potential signal interferences associated with placing bluetooth beacons throughout the streets.
ENVISION, as described in [40], employs a specific method to robustly and accurately detect static and dynamic obstacles in real-time video streaming captured by an average hardware capacity smartphone. Improvements can be made to the system by enhancing the obstacle recognition and classification modules to provide target users with a better understanding of their surroundings.
The Active Vision with Human-in-the-Loop for the Visually Impaired” (ActiVis) project, developed by [41], introduces a multimodal user interface that utilizes audio and vibration cues to convey navigational information to users. The current implementation of the ActiVis system is an android app based on a Tango device and a bone-conduction headset. Real-time adaptation to feedback parameters could enhance the system’s performance.
The Tactile Wayfinder, detailed in [42], comprises a tactile belt and a Personal Digital Assistant (PDA) running a wayfinder application. This application manages location and route information, transmitting path directions to the tactile display. Vibrators in the belt provide users with navigation guidance based on these directions.
3. Obstacles classification and characteristics
While navigating a path a blind individual can encounter many different obstacles.
After several safe and controlled re-enacting scenarios of a visually impaired person mobilizing the experiment path [1] we have identified two types of obstacles: Moving and Motionless.
Moving Obstacles: temporary obstacles that could be moved, pedestrians and animals are considered moving obstacles. Motion- less Obstacles: permanent obstacles that cannot be moved, could be electric polls, walls, or degraded concrete.
Table 1: List of most obvious and most common obstacles detected when experimenting
| Moving | Motionless |
| Cars | Light Poles |
| Potted Plant | Trees |
| Moving Signs | Holes |
| Animals | Bushes |
| Trash Bins | Boardwalk Edges |
| Piles Of Rock | Electric Poles |
| Motorbikes | Concrete Raised beds |
| Shop tents | Sewer Caps |
| Potato Chips Shelves | Stairs |
| Ice Cream Refrigerators | Store Decoration |
| Persons | Degraded Ground Concrete |
Listing all the moving and motionless obstacles is not possible, and the list that came out of our experiment is definitely not every single obstacle found on that street as shown in Table 1. A person can throw a glass bottle on the ground and that would lead to a creation of a new obstacle, which we did not specifically encounter but it is most likely to happen. Furthermore, we needed to go deeper with the classification. based on the state of art and our obstacles
listed above we have extracted the characteristics that obstacles share. The most critical characteristics that obstacles share is: size, position, risk, flexibility, velocity and sound.
In [22] a list of accident have been registered with blind individuals while navigation a road: Accidents with motorbikes and bicycles that rides on sidewalks, falling from stairs, falling into gaps between buses and their platform, bumping into building scaffolds and glass doors, Accidents with ironware and pipes transported over vehicles roof, Accidents with tree branches, telephone booths and charity boxes, bumping into objects along footpath, Accidents with passing bicycles, Accidents with passing vehicles, Accidents with parked automobiles, falling into holes, falling into pits, falling into underground rails.
In [43] various barriers were reported by blind individuals that impacted their safety: lag of precise location for a building entrance, unknown stairs and roadside holes, as well as obstacles above waist level, sidewalks and crossings, sidewalks often occupied by booths and bikes. Also, Public transport stops lacking audio information and traffic lights without audio output have been reported as an unsafe barrier by blind individuals.
In [44], a women reported the barriers that she have encountered: motorbikes parked on the sidewalks, potted plants, holes in the sidewalk, stairs, and uneven ground and she said she can’t count how often she had hurt her arm by bumping into motorbike handles, or hit her head or chin on something, or fallen into an uncovered ditch. She calls some of these sidewalks “death stations.”. Also, a 36-year-old blind man said that his foot became stuck in a hole in the sidewalk, he fell and had surgery and still can’t fully bend his leg.
In [45] they have identified that blind individuals may use sound to navigate and identify types of obstacles: auditory changes in the walking surface, the sounds of flowing water, and the touch of breeze and sunshine on the skin helped in understanding the changes in the environment and served as navigation cues.
4. The concept of our proposed navigation system
In real life context, if a blind individual is trying to navigate between two geographical points, he must adapt between many possible routes to achieve his destination. After choosing a route he will begin to parade towards his destination, whether guided or not. An early step of many steps in our navigation system is to propose for the blind individuals the less stressful route among the many possible routes to take between two points. The concept of -our proposed navigation system is as follows:
In a first step the blind individual will use a mobile application to choose vocally two geographical points at start and destination positions, the system will then identify the possible routes to take between these two points and propose vocally to the blind individual the less stressful route. To identify the less stressful route the system will calculate the index of difficulty for each possible route (IDR) and then select the route that has the lesser IDR value. After proposing the less stressful route the blind individual should adopt it and his traveling journey will start.
In step 2 the blind individual will begin to walk to his destination, while walking the system will identify and detect in real time the obstacles encountered by the blind individuals. notification and alerts will be forwarded vocally. The system will identify the type and the position of the obstacle.
5. Road difficulty index (IDR)
IDR depends on:
- sum of index of difficulty for each obstacle (IDO)
- total number of obstacles on the road
- road total length (xl)
- road slope (xs)
- accessibility of the road (xa)
- average number of obstacles per meter of road (xn)
$$IDR = \frac{\sum IDO}{1000 \cdot x_n \cdot x_l} + x_l + \frac{|x_s|}{10} + x_w + x_a + \frac{x_n}{2} \tag{1}$$
$$1 \leq IDR \leq 10 \tag{2}$$
5.1. IDR variables with their potential values
Each obstacle depends on six variables: size, position, risk, flexibility, velocity and sound. Each variable has been associated to a ponderation coefficient as shown in Table 2:
Table 2: Obstacle Variables
| Size | Position | Risk | Flexibility | Velocity | Sound |
| s | p | r | f | v | m |
| 2/24 | 5/24 | 8/24 | 3/24 | 4/24 | 2/24 |
$$IDO = \frac{1}{24} (2s + 5p + 8r + 3f + 4v + 2m) \tag{3}$$
$$1 \leq IDO \leq 5 \tag{4}$$
Obstacles can have different sizes, human beings perceive size of objects compared to his size thus size of obstacle is identified as small, normal or large. Values for variables are respectively +1 for a small obstacle, +3 for a normal obstacle and +5 for a large obstacle.
An obstacle can have a position compared to ground. Position can be assessed into two main categories above or below ground. For above ground position can be also assessed into two sub categories below waist or above waist. An obstacle above the ground below waist can be detected much easier than an obstacle below ground or above waist. An obstacle below ground can be detected with a cane much easier than an obstacle above waist. Therefore, values of variable p are respectively +1 for an obstacle above ground below waist, +3 for an obstacle below ground and +5 for an obstacle above ground above waist.
Obstacles when encountered can cause risks for humans. An obstacle can be not risky at all, an obstacle can cause small injuries and finally an obstacle can cause serious injuries. Therefore, values of variable r are respectively +1 for not causing risks, +3 for small injuries and +5 for serious injuries. An obstacle can present three levels of flexibility. An obstacle can be flexible, stiff and medium. A stiff obstacle can harm the blind and cause injuries, blind will be stressed in front of this kind of obstacle and will try to estimate the size of the obstacle to avoid it. Values of variable f are respectively +1 for a flexible obstacle, +3 for a medium obstacle and +5 for a stiff obstacle.
An obstacle can be stationary (fix) or have the capability to move. Moving obstacles can have low speeds or high speeds. A fixed object compared to a moving obstacle can be easily detected by blind person’s cane. Furthermore, low speeds compared to high speed obstacles can be easily detected by a blind person, although low speed obstacles can harm the blind but are less dangerous than high speed obstacles. Therefore, values of variable v are respectively +1 for fixed obstacles, +3 for moving obstacles with low speeds and +5 for moving obstacles with high speeds.
An obstacle can be a source of sound emission. The sound emitted by obstacles can be subbed into two categories: familiar sounds or unfamiliar ones. Obstacles with no sound are the hardest to detect because a blind person can use sounds to redirect and estimate the type of obstacles near him. Unfamiliar sounds will make the blind stressed but the blind can estimate or try to locate the source of the sound. Obstacles with familiar sounds are the easiest to detect or locate nearby (like car sounds, bike sounds, sound of human talking. . . ). Therefore, values of variable m are respectively +1 for an obstacle emitting familiar sounds, +3 for an obstacle emitting unfamiliar sounds and +5 for an obstacle not emitting sounds.
Example:
IDO calculation for an obstacle with the below characteristics:
- Large obstacle in size: s → +5
- Position is below ground: p → +3
- Small injuries in risks : r → +3
- Flexibility is stiff: f → +5
- Stationary obstacle: v → +1
- No sounds emission: m → +5
$$IDO = \frac{1}{24} (2 \cdot 5 + 5 \cdot 3 + 8 \cdot 3 + 3 \cdot 5 + 4 \cdot 1 + 2 \cdot 5) \tag{5}$$
$$IDO = \frac{78}{24} = 3.25 \tag{6}$$
Roads are travelled by a blind person from a starting point to a destination. The distance between a starting point and a destination point is usually measured in meters and designated as road length. Therefore, road total length (xl) is equal to road length/1000.
A road can be horizontally straight or can present slopes.by road we mean from the starting point to the destination point of the blind user or routes that are parts of a road from start to destination where each route can be considered as a road in itself. Therefore, road slope (xs) is the value of the road slope between 0 and 100%.
Accessibility for blind people may vary from road to road and country to country. Accessibility of a road for a blind person involves ensuring that individuals with visual impairments can navigate and travel safely and independently. Here are some criteria that makes a road accessible for blind users: clear sidewalks and pathways, tactile paving, audible signals at crosswalks, tactile cross- walks,. Therefore, accessibility of the road for blind people (xa) values are respectively 0 if the road is well accessible for a blind person, 0.5 if the road presents a medium accessibility and 0.75 if the road is not at all accessible for blind.
when traveling roads weather conditions may vary. Therefore, values of weather conditions variable (xw) are respectively 0 if no rain, 0.5 if rainy and 0.75 if snowy.
Finally, the last variable that IDR of a road depends on is average number of obstacles per meter of road (xn). Therefore, value of xn can be between 0 and maximum 2 obstacles/m (we considered that if this value is bigger than 2 the blind user would be sucked and cannot walk or move anymore).
Example:
IDR calculation for a road with the below characteristics:
- Road total length: → xl=250 m /1000 = 25
- Road slope: → xs=5
- Weather conditions rainy: → xw=5
- Accessibility of the road not at all: → xa=0.75
- Number of obstacles: → xn=04
- Total number of obstacles: → 10
- IDO = 1, 2, 3, 3.75, 2, 2.35, 1.3, 4.2, 1.1, 1.4
- \(\sum IDO = 21.3\)
$$IDR = \frac{21.3}{10} + 0.25 + 0.5 + 0.5 + 0.75 + 0.02 \tag{7}$$
$$IDR = 4.15 \tag{8}$$
5.1.1. ISR variables with their potential values:
ISR depends on different parameters:
- if blind person is used to the road (i1)
- if the blind person is traveling alone or having assistance (i2)
- if the blind person is having assistance from any hardware (i3)
- Stress initial status of the blind (i4,i5,i6,i7)
$$ISR = IDR \times (i_n) \tag{9}$$
$$ISR = IDR \times i_1 \times i_2 \times i_3 \times i_4 \times i_5 \times i_6 \times i_7 \tag{10}$$
$$0.015526 \leq ISR \leq 10 \tag{11}$$
Values of i1 are respectively +1 if the blind person is traveling the road for the first time, +0.75 if the blind has traveled the road a few times and +0.5 if the road is very well known.
Values of i2 are respectively +1 if the blind is traveling the road alone, +0.5 if he is traveling assisted by a dog and +0.25 if he is assisted by a person.
Values of i3 are respectively 1 if the user is not using either the cane or GPS, 0.75 if he is using any of the cane or GPS and 0.5 if he is using both of the cane and GPS.
i4 represents the value of fatigue, i4 values range between 0.5 and 1. i4 depends on three parameters: time of experimentation (it), age of the blind person (ia) and on earlier injuries (ii). it values are respectively +1 if experimentation is being held in the afternoon,
0.75 if it is being held in the noon and 0.5 if in the morning. ia values are respectively +1 if user age is greater or equal than 60, 0.5 if user age is greater or equal than 30 and 0.25 if user age is lesser than 30.
ii values are respectively +1 if user presents earlier injuries in both hands and legs, 0.5 if user presents injuries in hands only or legs only and 0.25 if the user doesn’t have injuries at all.
$$i_4 = \frac{i_t + i_a + i_i}{3} \tag{12}$$
i5 represents a value for the initial heart beat rate (bpm) at the starting point of the road, i5 values range between 0.5 and 1. Normal heart rate values range between 60 and 100 so we will consider that between this range i5 value will be equal to 0.5. the maximum bpm for any person is related to his age.
$$\text{max\_bpm} = 220 – \text{age} \tag{13}$$
Therefore i5 value will be equal to 1 if initial heart beat rate was bigger or equal than max bpm. If initially a blind person has a heart rate of x:
$$x > 100 \tag{14}$$
and
$$x < \text{max\_bpm} \tag{15}$$
i5 value will be equal to:
$$i_5 = 0.5 + \frac{0.5}{\text{max\_bpm} – 100} \cdot (x – 100) \tag{16}$$
i6 represents a value for the initial EDA at the starting point of a road, i6 values range between 0.5 and 1. normal EDA values collected with prototypes are distributed or range between 12 and 515 For an initial EDA value at the starting point of the road lesser or equal to 100 i6 will be equal to 0.5. For an initial EDA value at the starting point of the road bigger or equal to 500 i6 will be equal to 1. if an initial EDA value at the starting point of the road x is in between 100 and 500 i6 will be equal to:
$$i_6 = 0.5 + \frac{(x – 100) \cdot 0.5}{400} \tag{17}$$
i7 represents a value for the initial EMG at the starting point of a road, i7 values range between 0.5 and 1. normal EMG values collected with prototypes are distributed or range between 0 and 1000 For an initial EMG value at the starting point of the road lesser or equal to 200 i7 will be equal to 0.5. For an initial EDA value at the starting point of the road bigger or equal to 800 i7 will be equal to 1 . if an initial EMG value at the starting point of the road x is in between 200 and 800 i7 will be equal to:
$$i_7 = 0.5 + \frac{(x – 200) \cdot 0.5}{600} \tag{18}$$
6. Simulating the identification of the least stressful route
Any blind person can choose to travel from a starting point to a destination point. Same destination can be reached using different roads. Each road will have its own index of difficulty and its own index of stress. Our system will propose for the blind which road or segments to navigate based on the indexes. In this section we will describe the concept of our proposed navigation system by listing the details of two simulations. First simulation was taking the ex- ample of a blind user trying to navigate from university of Toulouse to cathedral of St Etienne. The second simulation was done on our experimental path in Lebanon. There is a notable difference between the two simulations. In the first simulation no ISRs were calculated since we don’t have any recorded bio signal values for any blind user (ISR is related to parameters specific for a blind user such as heart beat, EDA, EMG,,. . . )
6.1. Simulating the identification of the least stressful route on the experimental path
The annotated image is taken from google maps is shown in figure 1. It represents multiple roads that a blind person can take from the University of Toulouse, France to Cathedral Saint-Etienne. We are considering that the blind person is traveling from starting point to the destination point in a very good weather condition (no rain). Furthermore, all routes correspond to the same geometrical area with 155-meter elevation above sea level but presents no slopes and all the roads present none accessibility for blind Roads can have different lengths and different widths and different types.
All possible intersections are represented by Alphabetical letters with A the starting point (university of Toulouse). To start with the blind person has two possible road options AB or AC.
Based on the IDR values our navigation system will propose for the blind person the road which have the minimum IDR(AB) as shown in Table 3.When the blind is at point B, he has two possible roads that he can take to achieve his destination: BD or BE. Based on the IDR values shown in Table 4, our navigation system will propose for the blind person the road BD which has the minimum IDR.
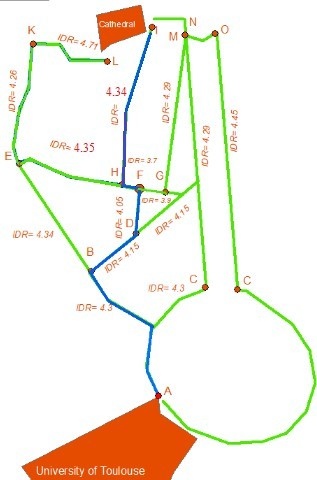
Table 3: Calculating the IDR for routes AB and AC
| Variable | AC | AB |
| xl | 0.247 | 0.24 |
| xa | 0.75 | 0.75 |
| xs | 0 | 0 |
| xw | 0 | 0 |
| Total number of obstacles detected | 68 | 70 |
| xn
. |
0.27 | 0.29 |
| IDO | 217 | 222 |
| IDR | 4.32 | 4.3 |
Table 4: Calculating the IDR for routes BD and BE
| Variable | BD | BE |
| xl | 0.073 | 0.205 |
| xa | 0.75 | 0.75 |
| xs | 0 | 0 |
| xw | 0 | 0 |
| Total number of obstacles detected | 28 | 36 |
| xn
. |
0.38 | 0.17 |
| IDO | 88 | 119 |
| IDR | 4.15 | 4.34 |
From point D, the blind person will be redirected into DF, because as can be seen on Figure 1 the route DF has the lowest IDR value. When the blind is at point F, he has two possible roads that he can take to achieve his destination FH or FG.
Table 5 shows that FH has the lowest IDR value and thus it is this road that will be advised to the blind person. Then, starting from point H, the less stressful road according to our approach is HI since, as shown in Table 6, it has less detected obstacles.
Table 5: Calculating the IDR for routes FH and FG
| Variable | FH | FG |
| xl | 0.014 | 0.04 |
| xa | 0.75 | 0.75 |
| xs | 0 | 0 |
| xw | 0 | 0 |
| Total number of obstacles detected | 5 | 10 |
| xn
. |
0.36 | 0.25 |
| IDO | 14 | 30 |
| IDR | 3.7 | 3.9 |
Table 6: Calculating the IDR for routes HI and HE
| Variable | HI | HE |
| xl | 0.23 | 0.18 |
| xa | 0.75 | 0.75 |
| xs | 0 | 0 |
| xw | 0 | 0 |
| Total number of obstacles detected | 54 | 49 |
| xn
. |
0.23 | 0.27 |
| IDO | 175.5 | 161 |
| IDR | 4.34 | 4.35 |
6.2. Simulating the identification of the least stressful route on the experimental path
Experiments were conducted on a road that has a total length of 800 meters as shown in Figure 2.
The road was partitioned into 3 equivalent sectors in length. Each of the sectors has a length of 265 meters. Each of the sectors has a well-known start and destination point and can be considered as a single road in itself. Sector 1 is represented with the line that connects A with B, sector 2 represented by the line that connects B to C, sector 3 represented by the line that connects C to D and sector-redirection represented by the line that connects C to E. Table 7 shows the IDR variables for each sector, Table 8 shows the IDR calculation for each sector.
6.2.1. ISR calculation for each sector for different experimentations
Each of the experimentation above listed in the table is done by a different user. So in total the Table 9 show experimentations done by 5 users.
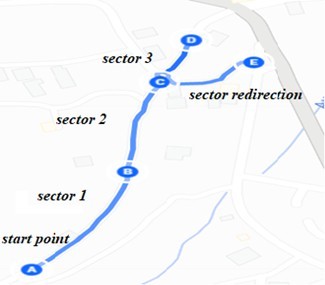
Table 7: Identifying IDR variables for each sector
| Variable | Sector 1 | Sector 2 | Sector 3 | Sector redirection |
| xl | 0.265 | 0.265 | 0.265 | 0.265 |
| xa | 0.75 | 0.75 | 0.75 | 0.75 |
| xs | 0 | 10 | 35 | 20 |
| xw | 0 | 0 | 0 | 0 |
| Total number of obstacles detected | 30 | 49 | 38 | 16 |
| xn | 0.11 | 0.18 | 0.14 | 0.06 |
| . IDO | 101 | 164 | 128 | 50 |
Table 8: IDR for each sector
| IDR | Sector 1 | Sector 2 | Sector 3 | Sector redirection |
| 4.1 | 5.1 | 7.6 | 6 |
Table 9: ISR for each sector
| Experimentation | Sector 1 | Sector 2 | Sector 3 | Sector redirec- tion |
| Exp 1 | 0.17 | 0.18 | 0.28 | 0.23 |
| Exp 2 | 0.16 | 0.25 | 0.42 | 0.34 |
| Exp 3 | 0.27 | 0.36 | 0.49 | 0.39 |
| Exp 4 | 0.19 | 0.32 | 0.51 | 0.38 |
| Exp 5 | 0.29 | 0.31 | 0.55 | 0.43 |
7. Implementing the concept into a real navigation system
The proposed navigation system is designed to accomplish two primary tasks. In the initial phase, the system suggests the least stressful route for blind individuals. The user begins by selecting a starting point and a destination, prompting the system to identify all possible routes and recommend the least stressful one.
In a subsequent stage, the system provides real-time navigation for the visually impaired individual. It detects obstacles encountered during navigation and, additionally, offer real-time voice alerts to inform the user about the type of obstacle encountered. Moreover, the system redirects the user along the entire path using voice instructions to ensure a smooth and stress-free navigation experience. The navigation system was first developed as a web application and then developed as a mobile application to allow users with visual impairment to have the ability to engage with the system through voice commands, and all communication from the system to the user are conveyed through voice feedback.
7.1. Identification of the least stressful route
The process initiates when the user opts to navigate from a chosen starting point to a designated destination. Upon selecting these points, the system analyses all potential routes connecting the two locations and determine the least stressful option. The present out- come of this procedure is to recognize and suggest the least stressful route for the user to navigate. Currently, this process is implemented as a web application using .NET and C#. Although, the developed web application is user-friendly for individuals without visual impairments, it may pose challenges for those who are blind. this process was also integrated into a mobile application and operated by blind individuals through voice commands. We will list below the different steps of the process lifecycle.
7.1.1. Choosing a navigation path
In the first step the user should decide on a navigation path. We will consider as an example that the user has chosen to navigate between the University of Toulouse and the Cathedral of Saint-Etienne in Toulouse, France. After choosing the navigation path a user can choose either to automatically get all possible roads to take between the starting point (university of Toulouse) and the destination point (Cathedral of Saint Etienne) or to manually precise each intersection that possibly could be taken in the chosen navigation path.
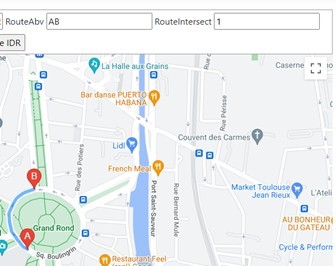
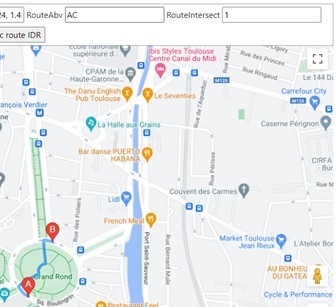
To get automatically all possible roads that can be taken between two points: the user should first redirect to the automated system view, after redirecting the user should indicate by clicking on the displayed google maps in the view the starting point and destination point. After indicating the starting and destination points the user clicks on the get Routes button Figure 3 and 4.
Possible roads that can be taken will be displayed on google maps. Figure 5 shows 3 possible roads to take between the university of Toulouse and the cathedral of Saint-Etienne. Furthermore, each possible road will be indexed and saved to SQL Database along with all longitude and latitude points that reside on this road as shown in Table 10 and 11.
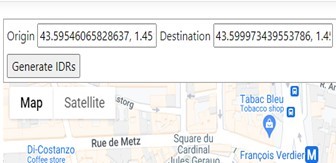

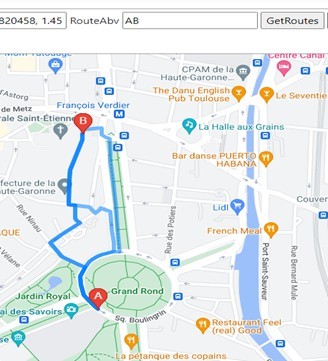
Table 10: All possible routes saved into database.
| Id | Route |
| 27 | Tone-0 |
| 28 | Tone-1 |
| 29 | Tone-2 |
Table 11: All geographical points for a route saved into database.
| Id | Longitude | Latitude | Route |
| 507 | 1.45124 | 43.59539 | 27 |
| 508 | 1.45139 | 43.59538 | 27 |
| 509 | 1.45125 | 43.59552 | 27 |
| 510 | 1.45116 | 43.59579 | 27 |
| 511 | 1.45114 | 43.59602 | 27 |
| 512 | 1.45128 | 43.59628 | 27 |
| 513 | 1.45141 | 43.59643 | 27 |
| 514 | 1.45166 | 43.59657 | 27 |
| 515 | 1.45211 | 43.59669 | 27 |
| 516 | 1.45231 | 43.59669 | 27 |
| 517 | 1.45231 | 43.59674 | 27 |
| 518 | 1.45221 | 43.59790 | 27 |
| 519 | 1.45204 | 43.59934 | 27 |
| 520 | 1.45201 | 43.59971 | 27 |
| 521 | 1.45201 | 43.59978 | 27 |
| 522 | 1.45196 | 43.59980 | 27 |
| 523 | 1.45189 | 43.59983 | 27 |
| 524 | 1.45178 | 43.59989 | 27 |
| 525 | 1.45179 | 43.59992 | 27 |
Users can also choose to manually indicate on the displayed google maps the possible roads that exist on the chosen navigation path As shown in Figure 6. He can choose to indicate on the map all possible two points that can be possibly taken for the same intersection As shown in Figure 7.
Each possible road for each intersection will be saved to SQL database along with all the longitude and latitude points that reside on this road.
7.1.2. Analyzing the routes
After storing the routes and the geographical points associated with each route in the SQL database, it is time now to analyze these routes. At first, we are calculating the total distance in meters for each route. To calculate the total distance for each route we are using Google maps Api. The total distance for each route is the sum of distances between two consecutive geographical points that reside in this route. After calculating distances for each route it is time now to identify the obstacles that a blind individual can encounter on these routes. To identify the obstacles related to each route we are using 3 Apis Google Maps, Google vision and Mapillary.
The Google Maps Static Api returns an image (either GIF, PNG or JPEG) in response to an HTTP request via a URL. For each request, we can specify the location of the map, the size of the image, the zoom level, the type of map, and the placement of optional markers at locations on the map. The Google Api offers powerful pre-trained machine learning models through REST and RPC Apis. Assign labels to images and quickly classify them into millions of predefined categories. Detect objects, read printed and handwritten text, and build valuable metadata into an image catalog. The Mapillary Api allows image extraction with object detection in bounding boxes.
Using Google maps Api and Mapillary we are extracting images associated with each geographical point that resides in a route knowing its longitude and latitude values. Using Google vision and Mapillary we are identifying the labels and objects for each image associated with a point that resides in a route. Each object or label extracted will be identified stored in the database further more will be associated an IDO as shown in Table 12.
Table 12: Detected objects or labels with their IDOS in the route indexed as tone-0
| Name | Route | ApiUsed | IDO |
| Car | Tone-0 | GoogleVision | 52 |
| Building | Tone-0 | GoogleVision | 88 |
| Car | Tone-0 | GoogleVision | 52 |
| Car | Tone-0 | GoogleVision | 52 |
| Wheel | Tone-0 | GoogleVision | 52 |
| Wheel | Tone-0 | GoogleVision | 52 |
| Car | Tone-0 | GoogleVision | 52 |
| Wheel | Tone-0 | GoogleVision | 52 |
| Car | Tone-0 | GoogleVision | 52 |
| Car | Tone-0 | GoogleVision | 52 |
| Person | Tone-0 | GoogleVision | 0 |
| Van | Tone-0 | GoogleVision | 0 |
| Bus | Tone-0 | GoogleVision | 52 |
| Bus | Tone-0 | GoogleVision | 52 |
| Bus | Tone-0 | GoogleVision | 52 |
| Bus | Tone-0 | GoogleVision | 52 |
| Building | Tone-0 | GoogleVision | 88 |
| Door | Tone-0 | GoogleVision | 0 |
| Car | Tone-0 | GoogleVision | 52 |
| Car | Tone-0 | GoogleVision | 52 |
| Building | Tone-0 | GoogleVision | 88 |
| Building | Tone-0 | GoogleVision | 88 |
| Furniture | Tone-0 | GoogleVision | 0 |
| Stop sign | Tone-0 | GoogleVision | 0 |
| Building | Tone-0 | GoogleVision | 88 |
| Person | Tone-0 | GoogleVision | 0 |
| Car | Tone-0 | GoogleVision | 52 |
7.1.3. Generating
IDR
After storing the routes in the Database along with their geographical points and after extracting and identifying objects associated with each route using Google Maps Api, Google vision Api and Mapillary Api it is Time now to generate for each route an IDR value.
To generate an IDR value for each route the system will apply the IDR formula.
$$IDR = \frac{\sum IDO}{1000 \cdot x_n \cdot x_l} + x_l + \frac{|x_s|}{10} + x_w + x_a + \frac{x_n}{2} \tag{19}$$
$$1 \leq IDR \leq 10 \tag{20}$$
- xa is equal to 0.75 for the accessibility of the road (following our example starting from the University of Toulouse to Cathedral of Saint-Etienne).
- xs is equal to 0 for the route
- xw is equal to 0, considering that the example was conducted in good weather conditions.
- xl is equal to the route total length divided by
- xn is the total count of all obstacles detected on the route divided by the route total length.
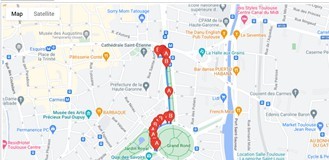
The system will be able to count the number of objects and labels associated with each route by retrieving from the database the labels and objects related to a route Id. The system will also calculate the total sum of IDOs associated with each object or labelled related to a route Id. The total length of each road is calculated by google maps API as stated before. After applying the IDR formula for each route as shown in Table 13, the system will then propose on the map the road with the least IDR for the user As shown in Figure 8.
Table 13: IDR generated and the length for each route.
| Id | Route | IDR | Length |
| 27 | Tone-0 | 3.363 | 613 |
| 28 | Tone-1 | 3.381 | 631 |
| 29 | Tone-2 | 4.438 | 688 |
7.2. Real-time navigation
This process comes after identifying the least stressful route. After proposing the least stressful route the blind user should begin to navigate into the proposed route. This process allows the user to navigate safely by getting directions via voice commands along the path and by identifying and detecting in real time the obstacles that can be encountered along the path.
7.2.1. Directing the blind individuals
Google maps Api provides for the blind user real-time directions while navigating the path. users will be directed by voice through the mobile application. Directions will be provided by the Google Maps Api
7.2.2. real-time obstacle detection
We used the built-in camera in the mobile along with image processing and machine learning techniques to identify and detect obstacles that can be encountered along the path. We are still researching this part in order to implement the best technique that will let us be able to detect and identify the majority of obstacles that can be encountered by a blind individual when navigating a route.
As for now we have been able to implement SSD [46] (Single shot detection) real time object detection with real time video capturing within a mobile application. SSD Is an object detector released in 2017, designed for mobile and embedded vision applications. This architecture uses proven depth-wise separable convolutions to build lightweight deep neural networks. The mobile application uses TensorFlow [47] lite implementation along with our embedded custom SSD trained model.
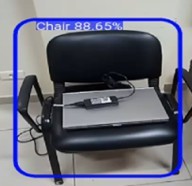
Our custom SSD model was trained on Google Colab [48] to be able to identify between two object classes: chairs and tables. Images for these two classes were extracted from different sources from the internet in order to acquire a big image set and be able to split the set into train and test sets in order to train the model accurately.
Our custom model works well for the two classes chairs and tables As shown in Figure 9, but can identify only these two classes. To be able to identify more obstacles it should be trained on different classes which means acquiring for each new class to be detected images related to this class and furthermore acquiring a big image set which will be time consuming but can be done if no other option is available. Due to these limitations we are using a default detection model trained on the COCO dataset that can detect between 70 to 90 classes.
8. Evaluation
The evaluation of our navigation system is a critical step in validating its functionality. This part is devoted to evaluating and testing the navigation system to make sure it satisfies user needs and in- tended goals. This section will outline the assessment procedure that was used, from collecting data sets to talking about the findings and conclusions. By doing a comprehensive analysis, we are able to see any possible problems, get useful input, and make informed decisions that will improve the prototype’s usability and efficacy. Our ultimate objective is to improve and optimize the prototype in order to better meet user requirements and project objectives.
8.1. Overview of the navigation system used in the experimentation
The navigation system discussed earlier, has been integrated into a mobile application to enhance accessibility for blind users. The original web application was not ergonomically suited for blind individuals, making the mobile adaptation necessary. This mobile application will primarily perform the functions outlined and de- scribed earlier.
First, the application will enable blind users to interact using voice commands to select their starting location and destination. Next, it will calculate the least stressful route. The application will then provide real-time voice-guided navigation and detect obstacles along the route. Additionally, biosignals related to stress will be continuously monitored and recorded in a Google Firebase database throughout the navigation process.
8.2. Experimentation protocol
The experiment involved navigating a route from a residential area to the municipality’s public building in the center of the town of Jezzine (the same starting point and destination as for contributions 1 and 2).
The route’s infrastructure is not accessible and is not user- friendly for blind users. Six blindfolded people conducted the experiment using the navigation system. Most of the users were between 20 and 35 years old. The users were all active, healthy, physically fit, and able to walk a path on their legs, not to mention that none of the users had a heart condition. The experiments were conducted in daylight and in cool weather. For all the experiments, all the users were in a resting state before the start of the test. The preparation time before the start of the test was recorded as was the duration of the entire test for each user. The average time for a user to complete the path and the entire test was around 25 minutes.
The least stressful route among all possible routes from the starting to destination point in the experimentation was chosen by the navigation system for all the users. The least stressful route chosen, show in Figure 10, was then divided into three sectors. Bio signals data gathered for each user were then grouped by sectors. Furthermore, each user has been asked to note his stress level within a range from 0 (no stress) to 10 (the most stressed) in each sector three times: at the beginning of each sector, in the center of the sector and at the end.
For each user, data stored in the Firebase database are initially extracted in JSON format. Subsequently, this JSON data is converted to CSV format using Python. This conversion facilitates proper manipulation, visualization, and analysis of the data. Each user’s CSV dataset may contain over 1000 records, with the number of records varying based on the total duration, in seconds, that the user spent walking the experimental path. The total number of records collected for all 6 users is 7892. The data samples, partitioned by sectors, are distributed as follows:
- Sector 1: 1497
- Sector 2: 3566
- Sector 3: 2829

8.3. Discussion
The heart rate, skin conductance and muscle activity values of all users were added together and filtered by sector. Then the mean for each of the measures was calculated for each sector. The obtained values are shown in Tables 14, 15, and 16.
Table 14: Mean heart beats per minute for each sector.
| Sector 1 | Sector 2 | Sector 3 | |
| Heart Beats (Means) | 93 | 97 | 99 |
Table 15: Mean skin conductance values for each sector.
| Sector 1 | Sector 2 | Sector 3 | |
| Skin Conductance (Means) | 303.5 | 348.1 | 358.1 |
Table 16: Mean muscle activity values for each sector.
| Sector 1 | Sector 2 | Sector 3 | |
| Muscle Activity (Means) | 447.3 | 485.5 | 485.47 |
A notable difference exists between the sectors concerning the heart beat, skin conductance, and muscle activity values, where we can notice that the lower means are in Sector 1, then in Sector 2 and the higher values in Sector 3. Additionally, as stated before, each user has auto-reported his stress level at the beginning, the center and the end of each sector. For each sector and for each user the highest values of stress reported was taken and added together. Next, the stress level was averaged for each sector, resulting in the values shown in Table 17. Clearly, the evolution of heart beat, skin conductance and muscle activity values are linked to the stress level. Both can accurately reflect the level of stress induced by the navigation path.
Table 17: Average stress levels for each sector
| Stress level (mean) | |
| Sector 1 | 1.3 |
| Sector 2 | 3.57 |
| Sector 3 | 4.5 |
In our experiment with the full navigation system, we analyzed a route selected by the system as the least stressful, which was di- vided into three sectors. By incorporating self-reported stress levels from each user, we observed that all physiological measures (heart rate, skin conductivity, and muscle activity) were influenced by the distance to obstacles. This finding corroborates the results from our previous experiments described in [1]. If we consider the Tables 18 up to 21 and the corresponding Figures 11 up to 14, the following observations can be made. Specifically, users exhibited the lowest values for all biosignal measures and reported the least stress in Sector 1. Both biosignal measures and self-reported stress levels increased progressively from Sector 1 to Sector 2 and from Sector 2 to Sector 3.
Notably, despite the sectors being of equal distance, Sector 1 was traversed the fastest by all users. The variations in physiological measures, self-reported stress levels, and travel times were associated with the sector characteristics, such as obstacle density and traffic level. The path was relatively short, approximately 800 meters in length. Sectors 1 and 2 were straight, while Sector 3 was a slope that required minimal physical effort. Additionally, four out of the six users were between 20 and 30 years old.
Compared to the results from the experiment described in our second contribution [1], and considering that users traveled from the same starting point to the same destination, this experiment shows the lowest mean values for all stress-related physiological signals and the lowest reported stress levels across all three sectors. This indicates that the navigation system was effective in reducing stress for blind individuals during navigation from the starting point to the destination point.

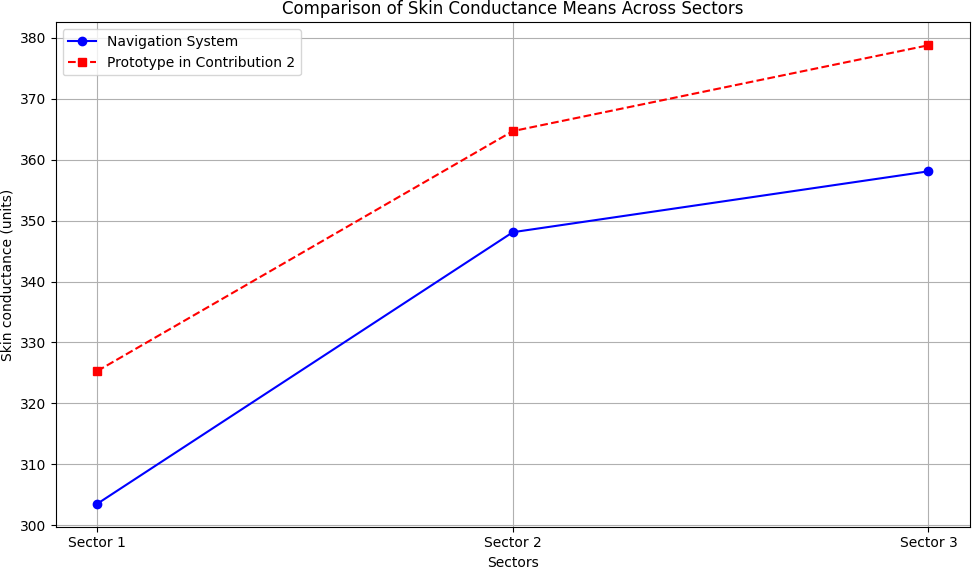
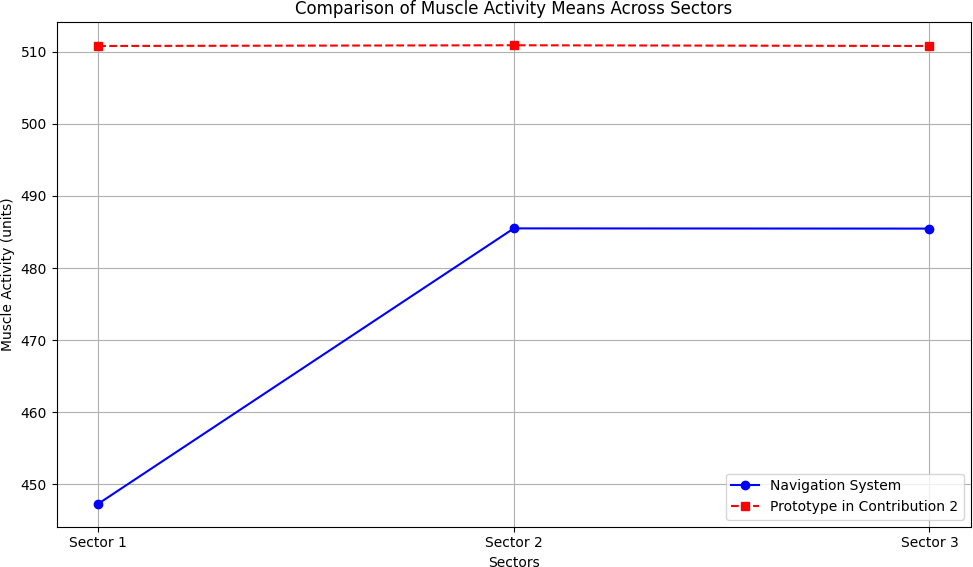

Table 18: Comparison of heart beats means across sectors.
| Sector 1 | Sector 2 | Sector 3 | |
| Using Navigation System | 93 | 97 | 99 |
| Using Prototype in Contribution 2 [1] | 99 | 101 | 102 |
Table 19: Comparison of skin conductance means across sectors.
| Sector 1 | Sector 2 | Sector 3 | |
| Using Navigation System | 303.5 | 348.1 | 358.1 |
| Using Prototype in Contribution 2 [1] | 325.3 | 364.7 | 378.8 |
Table 20: Comparison of muscle activity means across sectors.
| Sector 1 | Sector 2 | Sector 3 | |
| Using Navigation System | 447.3 | 485.5 | 485.47 |
| Using Prototype in Contribution 2 [1] | 510.8 | 510.9 | 510.8 |
Table 21: Comparison of self-reported stress means across sectors.
| Sector 1 | Sector 2 | Sector 3 | |
| Using Navigation System | 1.3 | 3.57 | 4.5 |
| Using Prototype in Contribution 2 [1] | 1.8 | 4 | 5.6 |
9. Conclusion
We have proposed a navigation system to help blind individuals to navigate safely and with less stress. Our navigation system performs two main tasks. Firstly, the navigation system suggests to the blind person the least stressful route to choose from the many possible routes between two points. Secondly, using image processing and machine learning techniques, the system detects in real time any obstacles that the blind person may encounter while navigating the route. In addition, the system provides real-time guidance to the blind person as he navigates the route.
The first process or task for the proposed system was implemented as a web application later on integrated in a mobile application. The proposed system can identify flawlessly any possible routes to take between two points and then propose for the user the route with the minimum IDR (least stressful route). Further- more, and for future works blind users’ feedback will be taken into consideration while identifying the least stressful route.
The second process, real-time object detection, was also implemented in a mobile application. We developed and trained our custom SSD model and tested it for two types of obstacle (a chair and a table). The custom model was able to accurately detect both classes. Our research continues into the second process, with the aim of building a model capable of detecting the majority of obstacles that a user may encounter.
Conflict of Interest The authors declare no conflict of interest.
- Y. Keryakos, Y. B. Issa, M. Salomon, A. Makhoul, “Correlation Between Types of Obstacles and Stress Level of Blind People in Outdoor Navigation,” in Proceedings of the International Wireless Communications and Mobile Computing Conference (IWCMC), Marrakech, Morocco, 2023, online: https://hal.archives-ouvertes.fr/hal-04224786.
- A. J. Ramadhan, “Wearable Smart System for Visually Impaired People,” Sensors, 18(3), 843, 2018, doi:10.3390/s18030843.
- R. K. Katzschmann, B. Araki, D. Rus, “Safe Local Navigation for Visually Impaired Users with a Time-of-Flight and Haptic Feedback Device,” IEEE Transactions on Neural Systems and Rehabilitation Engineering, 26(3), 583– 593, 2018, doi:10.1109/TNSRE.2018.2800665.
- G. Goncalves, H. Helena, “Indoor Location System Using ZigBee Technology,” in Proceedings of the 2009 Third International Conference on Sensor Technologies and Applications, 152–157, 2009, doi:10.1109/SENSORCOMM.2009.35.
- J. Karchˇn´ak, D. ˇSimˇs´ık, B. Jobb´agy, D. Onofrejov´a, “Feasibility Evaluation of Wearable Sensors for Homecare Systems,” Acta Mechanica Slovaca, 19(2), 58–62, 2015, doi:10.21496/ams.2015.016.
- D. Freitas, G. Kouroupetroglou, “Speech Technologies for Blind and Low Vision Persons,” Technology and Disability, 20(2), 135–156, 2008, doi:10.3233/TAD-2008-20208.
- C.-H. Lim, Y. Wan, B.-P. Ng, C.-M. S. See, “A Real-Time Indoor WiFi Localization System Utilizing Smart Antennas,” IEEE Transactions on Consumer Electronics, 53(2), 618–622, 2007, doi:10.1109/TCE.2007.381746.
- W. Elmannai, K. Elleithy, “Sensor-Based Assistive Devices for Visually- Impaired People: Current Status, Challenges, and Future Directions,” Sensors, 17(3), 565, 2017, doi:10.3390/s17030565.
- R. Kanan, O. Elhassan, “A Combined Batteryless Radio and WiFi Indoor Positioning for Hospital Nursing,” Journal of Communication and Software Systems, 12(1), 34–39, 2016, doi:10.24138/jcomss.v12i1.95.
- J. P. Gomes, J. P. Sousa, C. R. Cunha, E. P. Morais, “An Indoor Navigation Architecture Using Variable Data Sources for Blind and Visually Impaired Persons,” in Proceedings of the 13th Iberian Conference on Information Systems and Technologies (CISTI), 2018, doi:10.23919/CISTI.2018.8399264.
- L. Marco, G. Farinella, Computer Vision for Assistive Healthcare, Elsevier Science, Amsterdam, The Netherlands, 2018.
- A. Caldini, M. Fanfani, C. Colombo, “Smartphone-Based Obstacle Detection for the Visually Impaired,” in Image Analysis and Processing – ICIAP 2015, volume 9279 of Lecture Notes in Computer Science, 480–488, Springer International Publishing, 2015, doi:10.1007/978-3-319-23231-7 43.
- H.-C. Wang, R. K. Katzschmann, S. Teng, B. Araki, L. Giarre, D. Rus, “Enabling Independent Navigation for Visually Impaired People through a Wearable Vision-Based Feedback System,” in Proceedings of the 2017 IEEE International Conference on Robotics and Automation (ICRA), 6533–6540, 2017, doi:10.1109/ICRA.2017.7989772.
- R. Luo, X. Tan, R. Wang, T. Qin, J. Li, S. Zhao, E. Chen, T.-Y. Liu, “Light- Speech: Lightweight and Fast Text to Speech with Neural Architecture Search,” in Proceedings of the ICASSP 2021–2021 IEEE International Conference on Acoustics, Speech and Signal Processing (ICASSP), 5699–5703, 2021, doi:10.1109/ICASSP39728.2021.9414856.
- A. Karkar, S. Al-Maadeed, “Mobile Assistive Technologies for Visual Impaired Users: A Survey,” in Proceedings of the 2018 International Conference on Computer and Applications (ICCA), 427–433, 2018,
doi:10.1109/COMAPP.2018.8460195. - S. Phung, M. Le, A. Bouzerdoum, “Pedestrian lane detection in unstructured scenes for assistive navigation,” Computer Vision and Image Understanding, 149, 186–196, 2016, doi:10.1016/j.cviu.2016.01.011.
- L. Singh, P. Mazumder, G. Sharma, “Comparison of drug susceptibility pattern of Mycobacterium tuberculosis assayed by MODS (Microscopicobservation drug-susceptibility) with that of PM (proportion method) from clinical isolates of North East India,” IOSR Journal of Pharmacy, 4, 1–6, 2014, doi:10.9790/3013-04020201-06.
- P. Boss´e, “A Plant Identification Game,” American Biology Teacher, 39, 115, 1977, doi:10.2307/4445817.
- G. Sainarayanan, R. Nagarajan, S. Yaacob, “Fuzzy image processing scheme for autonomous navigation of human blind,” Applied Soft Computing, 7, 257–264, 2007, doi:10.1016/j.asoc.2005.06.005.
- National Instruments, “mySmartCane: Giving Freedom to Visually Impaired People,” 2018, accessed August 2018.
- V. Mustonen, M. Pantzar, “Tracking Social Rhythms of the Heart: From Dataism to Art,” Approaching Religion, 3(2), 16–21, 2013, doi:10.30664/ar.67512.
- A. Riazi, F. Riazi, R. Yoosfi, F. Bahmeei, “Outdoor difficulties experienced by a group of visually impaired Iranian people,” Journal of Current Ophthalmology, 28, 2016, doi:10.1016/j.joco.2016.04.002.
- I. F. B. Hairuman, O.-M. Foong, “OCR Signage Recognition with Skew and Slant Correction for Visually Impaired People,” in Proceedings of the 2011 11th International Conference on Hybrid Intelligent Systems (HIS), 306–310, 2011, doi:10.1109/HIS.2011.6122118.
- M. D. Messaoudi, B.-A. J. Menelas, H. Mcheick, “Autonomous Smart White Cane Navigation System for Indoor Usage,” Technologies, 8(3), 37, 2020, doi:10.3390/technologies8030037.
- J. Bai, D. Liu, G. Su, Z. Fu, “A Cloud and Vision-Based Navigation System Used for Blind People,” in Proceedings of the 2017 International Conference on Artificial Intelligence, Automation and Control Technologies (AIACT 17), 416–420, 2017, doi:10.2991/aiact-17.2017.93.
- O. Oladayo, “A Multidimensional Walking Aid for Visually Impaired Using Ultrasonic Sensors Network with Voice Guidance,” Int. J. Intell. Syst. Appl., 6, 53–59, 2014, doi:10.5815/ijisa.2014.08.06.
- C. Barberis, A. Andrea, G. Giovanni, M. Paolo, “Experiencing Indoor Navigation on Mobile Devices,” IT Prof., 16, 50–57, 2013, doi:10.1109/MITP.2013.54.
- J. Ducasse, A. M. Brock, C. Jouffrais, “Accessible interactive maps for visually impaired users,” in Mobility of Visually Impaired People, 537–584, Springer, 2018.
- J. Albouys-Perrois, J. Laviole, C. Briant, A. M. Brock, “Towards a Multisensory Augmented Reality Map for Blind and Low Vision People: A Participatory Design Approach,” in Proceedings of the 2018 CHI Conference on Human Factors in Computing Systems, 629:1–629:14, 2018, doi:10.1145/3173574.3174203.
- T. G¨otzelmann, K. Winkler, “SmartTactMaps: A Smartphone-Based Approach to Support Blind Persons in Exploring Tactile Maps,” in Proceedings of the 8th ACM International Conference on PErvasive Technologies Related to Assistive Environments, 2:1–2:8, 2015, doi:10.1145/2769493.2769497.
- Q. Liu, R. Li, H. Hu, D. bao Gu, “Building Semantic Maps for Blind People to Navigate at Home,” in 2016 8th Computer Science and Electronic Engineering Conference (CEEC), 12–17, IEEE, 2016, doi:10.1109/CEEC.2016.7835901.
- T. G¨otzelmann, “LucentMaps: 3D Printed Audiovisual Tactile Maps for Blind and Visually Impaired People,” in Proceedings of the 18th International ACM SIGACCESS Conference on Computers and Accessibility, 81–90, 2016, doi:10.1145/2982142.2982163.
- C. Gleason, A. Guo, G. Laput, K. Kitani, J. P. Bigham, “VizMap: Accessible Visual Information through Crowdsourced Map Reconstruction,” in Proceedings of the 18th International ACM SIGACCESS Conference on Computers and Accessibility, 273–274, 2016, doi:10.1145/2982142.2982180.
- D. Sato, U. Oh, K. Naito, H. Takagi, K. Kitani, C. Asakawa, “NavCog3: An Evaluation of a Smartphone-Based Blind Indoor Navigation Assistant with Semantic Features in a Large-Scale Environment,” in Proceedings of the 19th International ACM SIGACCESS Conference on Computers and Accessibility (ASSETS ’17), 270–279, 2017, doi:10.1145/3132525.3132535.
- A. Ganz, J. M. Schafer, Y. Tao, C. Wilson, M. Robertson, “PERCEPTII: Smartphone Based Indoor Navigation System for the Blind,” in Proceedings of the 36th Annual International Conference of the IEEE Engineering in Medicine and Biology Society (EMBC), 3662–3665, 2014, doi:10.1109/EMBC.2014.6944417.
- B.-S. Lin, C.-C. Lee, P.-Y. Chiang, “Simple Smartphone-Based Guiding System for Visually Impaired People,” Sensors, 17(6), 1371, 2017, doi:10.3390/s17061371.
- S. Ren, K. He, R. Girshick, J. Sun, “Faster R-CNN: Towards Real-Time Object Detection with Region Proposal Networks,” in Advances in Neural Information Processing Systems 28 (NIPS 2015), 91–99, 2015.
- J. Redmon, S. Divvala, R. Girshick, A. Farhadi, “You Only Look Once: Unified, Real-Time Object Detection,” in Proceedings of the IEEE Conference on Computer Vision and Pattern Recognition (CVPR), 779–788, 2016, doi:10.1109/CVPR.2016.91.
- T. V. Matar´o, F. Masulli, S. Rovetta, A. Cabri, C. Traverso, E. Capris, S. Torretta, “An Assistive Mobile System Supporting Blind and Visual Impaired People When Outdoors,” in Proceedings of the IEEE 3rd International Forum on Research and Technologies for Society and Industry (RTSI), 1–6, 2017, doi:10.1109/RTSI.2017.8065886.
- J. C. Lock, G. Cielniak, N. Bellotto, “A Portable Navigation System with an Adaptive Multimodal Interface for the Blind,” in Proceedings of the AAAI 2017 Spring Symposium on Designing the User Experience of Machine Learning Systems, 395–400, 2017.
- W. Heuten, N. Henze, S. Boll, M. Pielot, “Tactile Wayfinder: A Non-Visual Support System for Wayfinding,” in Proceedings of the 5th Nordic Conference on Human-Computer Interaction: Building Bridges, 172–181, ACM, 2008, doi:10.1145/1463160.1463179.
- R. Manduchi, J. Coughlan, “(Computer) Vision Without Sight,” Communications of the ACM, 55(1), 96–104, 2012, doi:10.1145/2063176.2063200.
- “A Survey: Outdoor Mobility Experiences by the Visually Impaired,” No further details available.
- “Obstacles for blind people,” https://iranhumanrights.org/2018/06/ drr-obstacles-for-blind-people/, 2018, accessed: 2023-08-28.
- M. Bandukda, A. Singh, N. Berthouze, C. Holloway, “Understanding Experiences of Blind Individuals in Outdoor Nature,” in Extended Abstracts of the 2019 CHI Conference on Human Factors in Computing Systems, CHI EA ’19, 1–6, Association for Computing Machinery, New York, NY, USA, 2019, doi:10.1145/3290607.3313008.
- W. Liu, D. Anguelov, D. Erhan, C. Szegedy, S. Reed, C.-Y. Fu, A. Berg, “SSD: Single Shot MultiBox Detector,” in Proceedings of the European Conference
on Computer Vision (ECCV), 21–37, 2016, doi:10.1007/978-3-319-46448-0 2. - M. Abadi, P. Barham, J. Chen, Z. Chen, A. Davis, J. Dean, M. Devin, S. Ghemawat, G. Irving, M. Isard, M. Kudlur, J. Levenberg, R. Monga, S. Moore, D. G. Murray, B. Steiner, P. Tucker, V. Vasudevan, P. Warden, M. Wicke, Y. Yu, X. Zheng, “TensorFlow: A System for Large-Scale Machine Learning,” in Proceedings of the 12th USENIX Symposium on Operating Systems Design and Implementation (OSDI 16), 265–283, 2016.
- E. Bisong, “Google Colaboratory,” in Building Machine Learning and Deep Learning Models on Google Cloud Platform: A Comprehensive Guide for Beginners, 59–64, Springer, 2019, doi:10.1007/978-1-4842-4470-8 7.