GC4miRNA - a Pipeline for Examining Impact of GC Content in miRNA Seed Sequences on Expression in Tumor Samples

Adv. Sci. Technol. Eng. Syst. J. 11(1), 78–83 (2026);
 DOI: 10.25046/aj110108
MicroRNAs (miRNAs) are small RNA molecules that play a crucial role in regulating gene expression by binding to and degrading targeted mRNAs. miRNAs targeting a specific mRNA have a region known as the “seed sequence”, which typically has a high affinity for its complementary sequence in the targeted mRNA. Single Nucleotide Polymorphisms (SNPs) are mutations that refer to the substitution of a single nucleotide. Alterations in the nucleotides of seed sequences can have a significant impact on the targeting strength between miRNAs and mRNAs, potentially resulting in dysregulation of genes, and causing various diseases, including cancers. It is crucial to assess the impact of SNPs will have on nucleotides in specific seed sequences by gauging a common factor (e.g. GC content) reflecting the binding affinity. GC content is an essential aspect in miRNA binding, since high GC content miRNAs are frequently more stable, and may have a stronger affinity for their targets. To reveal the GC content signature for cancer-associated miRNAs, we developed a bioinformatics pipeline called GC4miRNA, which can calculate GC percentage enrichment in a sequence and perform statistical analysis to compare the GC content between the seed sequence and whole sequence for targeting miRNAs using customized BASH and R scripts. The pipeline was implemented as an R Shiny application that carries out several tasks/modules, such as measuring similarities between miRNAs whose dysregulation is linked to cancer and identifying common patterns within miRNAs with greater GC content.
1.Introduction
The Cancer Genome Atlas (TCGA) is a project initiated by the National Cancer Institute to characterize cancer-causing biomarkers(https://www.cancer.gov/tcga) through the storage of omics data. There are 33 cancer subtypes that have been studied in the project. Much of this data has already been examined in different aspects; however, there are still many areas that have yet to be fully explored, particularly in the realm of miRNA.
MicroRNAs (miRNAs) are small molecules that regulate gene expression by targeting the 3’UTR region of genes. The specific targeting relationships between miRNAs and mRNAs can become incredibly complex because miRNAs can target multiple mRNA, or multiple miRNAs might be needed to target one mRNA [1]. The seed sequence of each miRNA is a region that facilitates the binding between miRNA and mRNA. This binding affinity is usually affected by the GC content of the seed sequence [2].
Single Nucleotide Polymorphisms (SNPs) are mutations that alter a single nucleotide. In cancers, miRNA could undergo mutations in their target sequences, or mutations could also affect the 3’ UTR of genes. Perfect base pairing between most of the seed sequence and its target is often needed for functional miRNA binding [3]. SNPs in seed sequences could disrupt the binding affinity between miRNAs and mRNAs. Over the years, many efforts have been made to elucidate the variations caused by SNPs across individuals, such as the 1000 Genome Project [4].
Motifs are short nucleotide sequences which usually have biological significance, such as acting as binding locations. Existing tools, such as MEME [5], are commonly used to identify motifs, which can then be analyzed for specific functions. So far, many bioinformatics tools have been developed to identify motif sites in the context of miRNA binding mechanisms using different computational approaches.
There is an urgent need to develop bioinformatics tools and methods to reveal the GC content signature for cancer-associated miRNAs. In this project, we developed a RShiny application that utilizes a pipeline of bioinformatics resources to calculate GC content, characterize differential expression patterns of miRNAs, perform statistical analysis for identified patterns, and determine important motifs within miRNA sequences.
2. Experimental Methods
To create this pipeline, we aimed to use the following steps to analyze the GC content signatures of the test dataset. The workflow of pipeline is shown in figure 1.
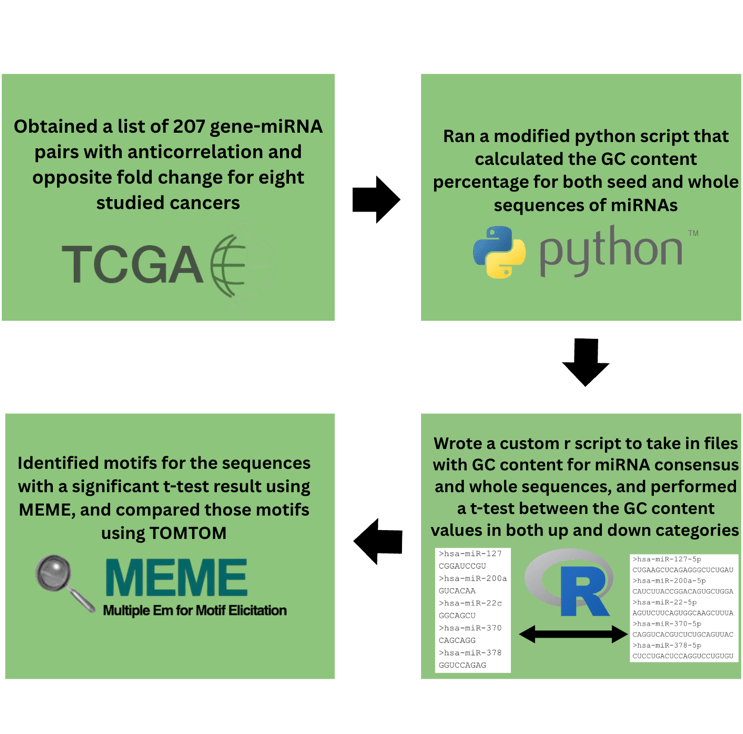
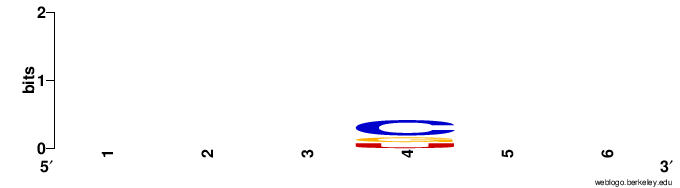
We downloaded a dataset from a previously published study [6] that found 238 miRNA-gene pairs whose dysregulation was associated with eight TCGA cancers. These pairs were initially discovered using the miRNA target prediction tools targetScan [7], targetProfiler [8], and miRanda [9], so these same tools were used with default parameters to find seed sequences for each miRNA-Gene pair. To find seed sequences with targetProfiler, we looked at the hairpin sequence that was generated, and recorded the nucleotides that were in a row, and thus more likely to be the seed sequence. Algorithm results could differ slightly in nucleotide sequence and length, so we kept only the sequences where at least two algorithms predicted the same result, or only one algorithm predicted a result. We generated logos (example shown in Figure 2) with WebLogo [10] for the consensus sequences with positive and negative correlation coefficients in tumor samples.
1.1. Retrieve miRNA 5p and 3p Sequences
We downloaded a file from miRbase [11] to find the complete sequences of miRNAs within our dataset. In order to efficiently search through this file for the relevant information, we compiled a list of every unique miRNA within our data and found the nucleotide sequence of the 5p and 3p strands of mature miRNA, before processing it. In some cases, it was unspecified whether the only given sequence was the 5p or 3p strand, so it was categorized as “Unclassified”. (Supplementary Table 1)
1.2. Calculate Normalized GC content
In order to calculate GC content for our Consensus, 5p, and 3p Sequences, we employed VectorBuilder’s “GC content Calculator” [12], which found GC content as well as the number of G’s and C’s in each sequence. To speed up the process, we also used a BASH script available in Github [13] that could calculate GC content for all sequences within a FASTA file. Due to the varying lengths of the seed sequences (6-8 nucleotides), we developed a formula (eq. 1) to calculate normalized GC content for each miRNA. When calculating normalized GC content for 5p and 3p sequences, we disregarded unclassified sequences from the total count of miRNAs.
$$
norm(GC)=\frac{\#GC \times 100}{\#NC \times \frac{\#Total\ GC}{\#miRNA}}
\tag{1}
$$
Formula for normalizing GC content of miRNA sequences. (Note: #NC is the nucleotide count in that specific miRNA, #Total GC is the total number of G’s and C’s for that specific kind of miRNA sequence in the cancer, and #miRNA is the number of miRNAs that are associated with the cancer)
1.1. Identify Differentially Expressed miRNAs
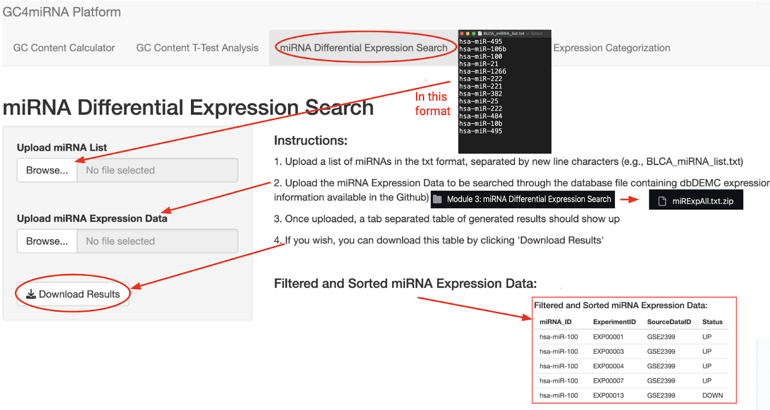
Next, we utilized the dbDEMC database [14] of experimental data to find whether the miRNAs we were examining were being upregulated or downregulated within the cancers their dysregulation was associated with. We downloaded a file containing all the experimental and expression information from dbDEMC, before applying Unix commands to retrieve the necessary information. We only kept experiments that analyzed TCGA data, since our original pairs were selected by studying TCGA datasets. Finally, we reported the differential expression of miRNAs, as well as the experimental ID of the experiment where the information was drawn from.
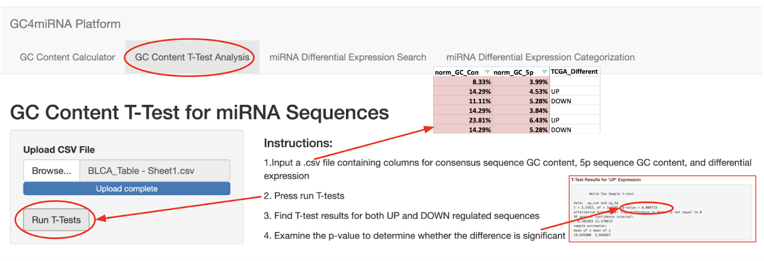
1.2. Calculate Statistical Significance of GC content in Consensus Sequences
We created an R script to run a Student’s t-test on the GC content between consensus and 5p sequences within groups with different differential expressions for each cancer. We considered any result with a p-value below 0.05 to be significant.
1.3. Identify Significant Motifs for Differentially Expressed miRNAs
After finding out which 5p sequences had a significant difference in GC content from their consensus sequences, we ran MEME with default parameters to find the top three motifs of all miRNA 5p sequences with a certain differential expression. We considered any motif with an E-value below 0.05 to be significant.
2. Results
2.1. Identified Sequences of Mature miRNAs
We found mature sequences for all our miRNAs, but roughly 14 sequences had an unclassified rating, and were not included in any of our mature-miRNA analysis. Although LUSC has the highest proportion of unclassified miRNA sequences, there were only four pairs within our study associated with LUSC. The miRNAs associated with KICH had no unclassified sequences.
2.2. Calculated and Normalized GC content of miRNA Sequences
We reported that the average normalized GC content for all mature miRNAs was similar between most cancers. The average GC content for 5p and 3p miRNA sequences were very similar (~5%). However, the average normalized GC content for upregulated seed sequences was higher (by 4% or more) than downregulated seed sequences for BLCA and THCA. In LIHC and LUSC, downregulated miRNAs had average normalized GC contents that were higher (by 3% or more) than upregulated miRNAs. There was a less than 1% difference in average GC content between the two groups for HNSC, KICH, and THCA.
| Cancer | Average normalized GC content for consensus sequences | Average normalized GC content for 5p sequences | Average normalized GC content for 3p sequences |
|---|---|---|---|
| BLCA | 14.45% (19.64%, 12.94%) |
4.89% (5.67%, 5.15%) |
4.95% (6.04%, 4.62%) |
| HNSC | 14.13% (13.75%, 14.65%) |
4.51% (4.42%, 4.65%) |
4.54% (4.14%, 4.72%) |
| KICH | 13.89% (13.18%, 13.23%) |
4.55% (4.51%, 4.64%) |
4.55% (4.67%, 4.70%) |
| KIRP | 13.98% (15.04%, 11.42%) |
4.50% (4.60%, 4.39%) |
4.52% (4.69%, 3.98%) |
| LIHC | 13.98% (13.51%, 16.59%) |
4.48% (4.24%, 5.08%) |
4.52% (4.35%, 5.27%) |
| LUSC | 14.29% (13.45%, 16.81%) |
4.55% (4.41%, 4.81%) |
4.61% (4.23%, 5.37%) |
| THCA | 13.78% (13.99%, 14.41%) |
4.51% (4.39%, 5.52%) |
4.57% (4.48%, 5.78%) |
| UCEC | 14.49% (17.36%, 13.30%) |
4.51% (4.21%, 4.93%) |
4.52% (4.56%, 4.44%) |
2.3. Differential Expression and Gene Analysis results
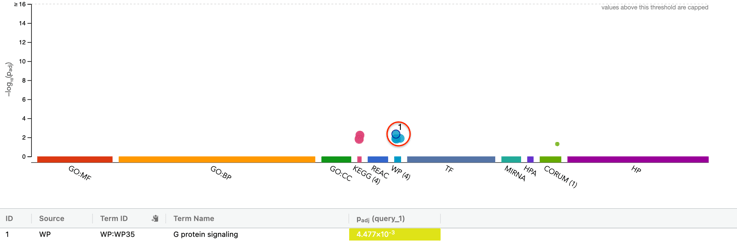
We identified differential expression patterns based on TCGA data for most of our miRNAs, and found that for most cancers excluding THCA, there were more cases where miRNA was upregulated or downregulated. To elucidate the functions of the genes which these miRNAs were targeting, we used gProfiler [15] and ClueGo [16] to find commonly enriched terms in each cancer (Supplementary Table 2). In KIRP, three genes were annotated by ClueGo which are involved within the process of aldehyde metabolism. In LIHC, two genes: PRKCZ and ADCY4, were reported to be involved in eight different pathways, such as G-Protein, Relaxin, Chemokine, and Rap1 signaling. SiRNA knockdowns of PRKCZ have been known to decrease cancer cell migration and invasion [17] and shown in figure 3.
2.4. Statistical Analysis results
Our Student’s t-test confirmed the significance of the GC content within all our miRNAs except for LUSC, which had only 4 miRNA sequences. Overall, the p-values were below 0.01 for all cancers (Table 2), and the GC content difference between consensus and whole sequences for upregulated miRNAs seemed to be more significant than downregulated ones in most cancers, possibly indicating that upregulated miRNAs were more enriched with GC content within their seed sequences, though this needs further testing on a much larger scale. For KIRP, a very significant p-value could be due to its bigger sample size (more than 40 miRNA-gene pairs).
| Cancer | Up | Down |
|---|---|---|
| BLCA | p-value = 0.008733 | p-value = 0.005622 |
| HNSC | p-value = 3.059e-06 | p-value = 5.553e-06 |
| KICH | p-value = 5.52e-08 | p-value = 0.0002546 |
| KIRP | p-value < 2.2e-16 | p-value = 0.0001013 |
| LIHC | p-value = 9.975e-07 | p-value = 0.001259 |
| LUSC | p-value = 0.2229 | not enough ‘x’ observations |
| THCA | p-value = 4.863e-12 | p-value = 0.02901 |
| UCEC | p-value = 0.00305 | p-value = 0.009271 |
Note: Bolded p-values are significant.
2.5. Motif Analysis results
After generating logos for the miRNAs with a significant GC content with MEME and inspecting their E-values, we discovered five significant (E-value<0.05) motifs for upregulated miRNAs in HNSC, KICH, KIRP, LIHC, and UCEC (Table 3). We also found one significant logo for BLCA in downregulated miRNAs (data not shown). There are more GC content-based motifs in upregulated miRNA sequences compared to downregulated miRNA sequences, which could be explained by our previous observation that there is more enriched GC content in upregulated miRNA sequences.
| Cancer | miRNA IDs | E-value | Logo |
|---|---|---|---|
| HNSC | hsa-mir-183 hsa-mir-182 hsa-mir-1296 |
3.6e-002 |  |
| KICH | hsa-mir-182 hsa-mir-1266 hsa-mir-629 hsa-mir-183 hsa-mir-222 hsa-mir-589 |
9.5e-003 |  |
| KIRP | hsa-mir-17 hsa-mir-20a hsa-mir-106b hsa-mir-93 |
4.1e-011 |  |
| LIHC | hsa-mir-17 hsa-mir-20a |
2.7e-002 |  |
| UCEC | hsa-mir-106b hsa-mir-17 hsa-mir-183 hsa-mir-301a |
3.3e-002 |  |
2.6. GC4miRNA RShiny App
We combined all our developed modules into one application, and we uploaded a variety of resources along with individual programs and instructions into a GitHub page (https://github.com/braydonlu/GC4miRNA), so that it could be downloaded and run locally.
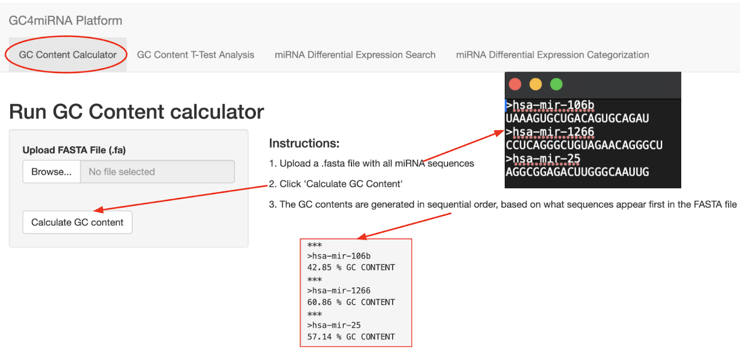
Module 1 was the customized GC content calculator, which was made by converting the source code from “Abby’s Amazing GC Calculator” publicly available in GitHub into a RShiny script. A screenshot of Module 1 is shown in figure 4.
Module 2 can take GC content information to test the statistical significance between miRNA seed sequences and whole sequences for each category using a Student’s t-test. A screenshot for Module 2 is shown in figure 5.
Module 3, which we developed, can search through dbDEMC to find expression data, by using an input list of miRNAs to search through a dbDEMC dataset. A screenshot for Module 3 is shown in figure 6.
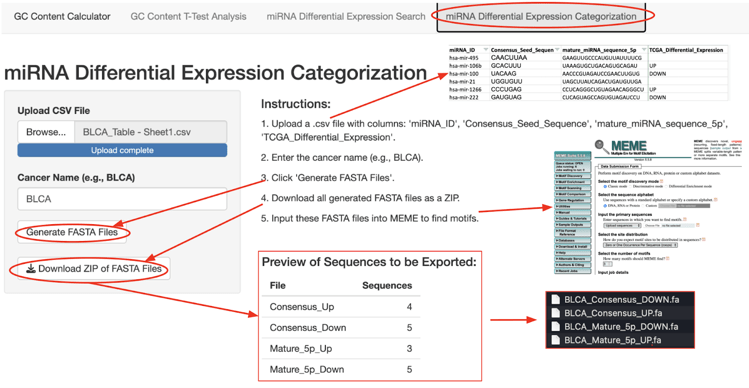
Module 4 can generate FASTA files used for running motif detection software. Specifically, it works by reformatting a list containing miRNA IDs and sequences into FASTA files. The screenshot for Module 4 is shown in figure 7.
3. Discussion
In this study, we developed a RShiny application with several modules to evaluate GC content within seed sequences of cancer-associated miRNAs, and to identify significant motifs within these miRNA sequences. We also utilized a novel method of normalizing GC content for miRNA seed sequences, so that sequence length would not bias our results. This allows us to analyze the relationship between miRNA expression in tumor cells and the GC content in seed sequences, helping to explain changes in binding affinity that can lead to gene dysregulation in cancer.
We used the GC content statistical analysis module to identify if any miRNA seed sequences would have significantly more GC content within its seed sequence than the whole sequence. After normalizing our calculated GC content, we found that every input list of miRNAs associated with studied cancer types, except those associated with LUSC, had seed sequences with a significant (p-value < 0.05) GC content compared to the rest of the sequence. This is interesting, because for miRNA seed sequences to have strong binding affinities, they could have high GC content. According to a previous study [18], high GC content within miRNA seed sequences has been associated with higher percentages of seed-pairing targets, and our results suggest that miRNAs with GC-rich seed sequences are highly important in regulating multiple gene pathways.
After categorizing most of our miRNAs with the miRNA differential expression search module, we also found that most upregulated miRNAs tended to have more significant p-values than downregulated miRNAs based on the results from Student’s t-test. This could imply that changes in seed sequences with high GC content are likely to cause that miRNA to lose some of its functionality and thus lead to its upregulation to achieve the normal level of gene regulation.
Additionally, many of these upregulated miRNAs had significant(E-value<0.05) motifs within its 5p miRNA sequence, which could indicate these motifs are important to the functionality of miRNA binding. Alteration of GC content, as well as conserved motifs, might imply a role in how that miRNA is expressed within tumor samples [19].
We have demonstrated that our pipeline is able to conduct analysis on GC content relating to its effect on regulation of miRNAs in tumor cells. Through working with an example dataset of 207 miRNA-gene pairs, we were able to identify some interesting results for several TCGA cancer types we studied. KICH had extremely low p-values(<3e^-4) for its Student’s t-test, and when we used MEME to find motifs, KICH had a significant motif, with an E-value of 9.5e^-3. We further examined the 7-nucleotide long motif we found by checking TOMTOM [20], and we found matches to motifs within genes coding for zinc finger formation in mouse analogs. Some members in the zinc finger protein family have been found to be important biomarkers in kidney cancer [21,22].
The gene ontology results for KICH also had consistently low p-values for each enriched term. In our gene functional analysis, we determined that two genes, FTCD and MTHF1D, were enriched with terms such as “Histidine Metabolic Processes” and “Disorders of folate metabolism and transport”. These processes are crucial in many different types of cells, but can also prolong the longevity of tumors; upregulation of MTHF1D in cancer cells has been associated with worse prognosis for oral squamous cell cancer patients [23]. We looked at the miRNAs associated with these two genes and discovered both were targeted by has-miR-625. A previous study on renal carcinomas specifically examined the impact of hsa-miR-625-3p, and found that it promoted cell migration and invasion, and reduced apoptosis [24]. However, this study did not mention the impact of FTCD and MTHF1D in its gene ontology results. Additionally, has-miR-625 was not found in the list of miRNAs containing the significant motif for LIHC, indicating that it might have a different conserved sequence.
Through our pipeline, we were able to analyze GC content rich seed sequence motifs that may play important roles in gene regulation involving oncogene or tumor suppressor pathways. For future research, we hope to uncover the roles of specific mutations in disrupting binding patterns, and how the dysregulation of genes could cause certain cancers. We could apply machine learning methods to predict the specific effects of miRNA mutations on its binding affinity by analyzing how these binding patterns impact both primary sequence recognition and secondary sequence conformation. This machine learning algorithm could be trained on trained on experimentally validated miRNA–mRNA interaction datasets, and its results could be cross-referenced with publicly available transcriptomics profiles from cancer patient cohorts. This way, we could potentially identify specific mutations within seed sequences that are most associated with dysregulated oncogenic pathways.
We worked with a very limited dataset in this study, so we believe that our findings could be strengthened through incorporating more samples. This may be achieved through studying the International Cancer Genome Consortium Accelerating Research through Genomic Ontology (ICGC ARGO) database (http://platform.icgc-argo.org) [25].
- S.Y. Ying, D.C. Chang, S.L. Lin, “The microRNA (miRNA): overview of the RNA genes that modulate gene function”, Molecular Biotechnology, 38(3):257-268, 2008, DOI: https://doi.org/10.1007/s12033-007-9013-8
- M. Marzec, “New insights into the function of mammalian Argonaute2”, PLoS Genetics, 16(11):e1009058, 2020, DOI: https://doi.org/10.1371/journal.pgen.1009058
- C. Li, C. Mou, M.D. Swartz, B. Yu, Y. Bai, Y. Tu, X. Liu, “dbMTS: A comprehensive database of putative human microRNA target site SNVs and their functional predictions”, Human Mutation, 41(6):1123-1130, 2020, DOI: https://doi.org/10.1002/humu.24020
- A. Auton, L.D. Brooks, R.M. Durbin, E.P. Garrison, H.M. Kang, J.O. Korbel, J.L. Marchini, S. McCarthy, G.A. McVean, G.R. Abecasis, “A global reference for human genetic variation”, Nature, 526(7571):68-74, 2015, DOI: https://doi.org/10.1038/nature15393
- T.L. Bailey, J. Johnson, C.E. Grant, W.S. Noble, “The MEME Suite”, Nucleic Acids Research, 43(W1):W39-W49, 2015, DOI: https://doi.org/10.1093/nar/gkv416
- Y. Bai, L. Ding, S. Baker, et al., “Dissecting the biological relationship between TCGA miRNA and mRNA sequencing data using MMiRNA-Viewer”, BMC Bioinformatics, 17(13):336, 2016, DOI: https://doi.org/10.1186/s12859-016-1219-y
- V. Agarwal, G.W. Bell, J.W. Nam, D.P. Bartel, “Predicting effective microRNA target sites in mammalian mRNAs”, eLife, 4:e05005, 2015, DOI: https://doi.org/10.7554/eLife.05005
- A. Oulas, N. Karathanasis, A. Louloupi, I. Iliopoulos, K. Kalantidis, P. Poirazi, “A new microRNA target prediction tool identifies a novel interaction of a putative miRNA with CCND2”, RNA Biology, 9(9):1196-1207, 2012, DOI: https://doi.org/10.4161/rna.21725
- B. John, A.J. Enright, A. Aravin, T. Tuschl, C. Sander, D.S. Marks, “Human MicroRNA targets”, PLoS Biology, 2(11):e363, 2004, DOI: https://doi.org/10.1371/journal.pbio.0020363
- G.E. Crooks, G. Hon, J.M. Chandonia, S.E. Brenner, “WebLogo: a sequence logo generator”, Genome Research, 14(6):1188-1190, 2004, DOI: https://doi.org/10.1101/gr.849004
- S. Griffiths-Jones, R.J. Grocock, S. van Dongen, A. Bateman, A.J. Enright, “miRBase: microRNA sequences, targets and gene nomenclature”, Nucleic Acids Research, 34:D140-D144, 2006, DOI: https://doi.org/10.1093/nar/gkj112
- VectorBuilder, “GC-content-Calculator”, VectorBuilder, 2025, URL: https://en.vectorbuilder.com/tool/gc-content-calculator.html
- Abbykatb, “Abby’s Amazing GC Calculator”, GitHub, 2025, URL: https://github.com/abbykatb/Abbys-Amazing-GC-Calculator
- Z. Yang, F. Ren, C. Liu, S. He, G. Sun, Q. Gao, L. Yao, Y. Zhang, R. Miao, Y. Cao, et al., “dbDEMC: a database of differentially expressed miRNAs in human cancers”, BMC Genomics, 11(4):S5, 2010, DOI: https://doi.org/10.1186/1471-2164-11-S4-S5
- L. Kolberg, U. Raudvere, I. Kuzmin, J. Vilo, H. Peterson, “gprofiler2 — an R package for gene list functional enrichment analysis and namespace conversion toolset”, F1000Research, 9:ELIXIR-709, 2020, DOI: https://doi.org/10.12688/f1000research.24956.2
- G. Bindea, B. Mlecnik, H. Hackl, P. Charoentong, M. Tosolini, A. Kirilovsky, W.H. Fridman, F. Pagès, Z. Trajanoski, J. Galon, “ClueGO: a Cytoscape plug-in to decipher functionally grouped gene ontology and pathway annotation networks”, Bioinformatics, 25(8):1091-1093, 2009, DOI: https://doi.org/10.1093/bioinformatics/btp101
- S. Yao, A. Bee, D. Brewer, A. Dodson, C. Beesley, Y. Ke, L. Ambroisine, G. Fisher, H. Møller, T. Dickinson, et al., “PRKC-ζ Expression Promotes the Aggressive Phenotype of Human Prostate Cancer Cells and Is a Novel Target for Therapeutic Intervention”, Genes & Cancer, 1(5):444-464, 2010, DOI: https://doi.org/10.1177/1947601910376079
- X. Wang, “Composition of seed sequence is a major determinant of microRNA targeting patterns”, Bioinformatics, 30(10):1377-1383, 2014, DOI: https://doi.org/10.1093/bioinformatics/btu045
- P. Agrawal, G. Olgun, A. Singh, V. Gopalan, S. Hannenhalli, “Characterizing the role of exosomal miRNAs in metastasis”, bioRxiv, 2024:2024.08.20.608894, 2024, DOI: https://doi.org/10.1101/2024.08.20.608894
- S. Gupta, J.A. Stamatoyannopoulos, T.L. Bailey, W.S. Noble, “Quantifying similarity between motifs”, Genome Biology, 8(2):R24, 2007, DOI: https://doi.org/10.1186/gb-2007-8-2-r24
- S.O. Heyliger, K.F.A. Soliman, M.D. Saulsbury, R.R. Reams, “The Identification of Zinc-Finger Protein 433 as a Possible Prognostic Biomarker for Clear-Cell Renal Cell Carcinoma”, Biomolecules, 11(8):1193, 2021, DOI: https://doi.org/10.3390/biom11081193
- L. Wang, Q. Li, Z. Ye, B. Qiao, “ZBTB7/miR-137 Autoregulatory Circuit Promotes the Progression of Renal Carcinoma”, Oncology Research, 27(9):1007-1014, 2019, DOI: https://doi.org/10.3727/096504018X15231148037228
- W. Wang, W. Gu, H. Tang, Z. Mai, H. Xiao, J. Zhao, J. Han, “The Emerging Role of MTHFD Family Genes in Regulating the Tumor Immunity of Oral Squamous Cell Carcinoma”, Journal of Oncology, 2022:4867730, 2022, DOI: https://doi.org/10.1155/2022/4867730
- L. Zhao, K. Liu, X. Pan, J. Quan, L. Zhou, Z. Li, C. Lin, J. Xu, W. Xu, X. Guan, H. Li, L. Ni, Y. Gui, Y. Lai, “miR-625-3p promotes migration and invasion and reduces apoptosis of clear cell renal cell carcinoma”, American Journal of Translational Research, 11(10):6475-6486, 2019.
- J. Zhang, R. Bajari, D. Andric, et al., “The International Cancer Genome Consortium Data Portal”, Nature Biotechnology, 37(4):367-369, 2019, DOI: https://doi.org/10.1038/s41587-019-0055-9