Smartphone Based Heart Attack Risk Prediction System with Statistical Analysis and Data Mining Approaches
 , Saikat Mondal 2, Pritam Khan Boni 3, Arun More 2, Md. Omar Faruqe Sagor 4
Adv. Sci. Technol. Eng. Syst. J. 2(3), 1815–1822 (2017);
 DOI: 10.25046/aj0203221
Nowadays, Ischemic Heart Disease (IHD) (Heart Attack) is ubiquitous and one of the major reasons of death worldwide. Early screening of people at risk of having IHD may lead to minimize morbidity and mortality. A simple approach is proposed in this paper to predict risk of developing heart attack using smartphone and data mining. Clinical data from 835 patients was collected, analyzed and also correlated with their risk existing clinical symptoms which may suggest underlying non detected IHD. A user friendly Android application was developed by incorporating clinical data obtained from patients who admitted with chest pain in a cardiac hospital. Upon user input of risk factors, the application categorizes the level of IHD risks of the user as high, low or medium. It was found by analyzing and correlating the data that there was a significant correlation of having an IHD and the application results in high & low, medium & low and medium & high categories; where the p values were 0.0001, 0.0001 and 0.0001 respectively. The experimental results showed that the sensitivity and accuracy of the proposed technique were 89.25 % and 76.05 % respectively, whereas, using C4.5 decision tree, accuracy was found 86% and sensitivity was obtained 91.6%. Existing tools need mandatory input of lipid values which makes them underutilized by general people; though these risk calculators bear significant academic importance. Our research is motivated to reduce that limitation and promote a risk evaluation on time.
1. Introduction
Cardiovascular diseases (CVDs) including Ischemic Heart Disease (IHD) are one of the major causes of death globally. As per the report of World Health Organization (WHO), in 2014, the death rate is 6.96% in Bangladesh due to Ischemic Heart Diseases, which ranks it first as the cause of death [1], [2]. WHO also forecasts that CVDs would be contributing to 24% as cause of death by 2030 and recommended to take extensive initiatives at various levels to reduce the mortality and morbidity out of IHDs [3].
For many diseases, prevention is better than cure and IHD is one of them and it can be primarily, primordially and secondarily prevented [1]. A good approach to prevent the improvement of risk factors or control of the risk factors will decline the risk of IHD. Having episode of IHD has long lasting impacts on the individual from having repeated episodes of chest pain to having limited quality of life due to heart failure and even death. There will be significant advantages if the people are made aware for health and preventive health checks for IHD [4]. With the known risk factors, calculating and categorizing a person into a risk level may help the person to be motivated for a preventive health check so that mortality can be reduced by detecting possibility of IHD earlier.
We developed a robust tool to forecast the threat of developing Ischemic Heart Disease (Heart Attack) using smartphone based application in android platform that may push much of population to check their own risk. This application generates a score based on the input and classifies the person into low, medium or high risk. The application also guides the person for further work up based on the result.In current age, smartphones are one of the most widely utilized technologies worldwide and various smartphone based health apps are benefitting to people. Development of a smartphone based tool to predict heart attack risk would benefit masses of people. Currently, there are several tools like Framingham risk calculators, ASCVD risk calculator [5] available in the world to forecast risk of IHD which bear excellent academic significance but are underutilized by general people due to few limitations like mandatory inputs of Lipid profile and Blood Pressure (BP) values moreover, these risk scores do not individualizes the risk.
This paper is an extension of our previous work titled “Smartphone Based Ischemic Heart Disease (Heart Attack) Risk Prediction using Clinical Data and Data Mining Approaches, a Prototype Design” originally published and presented in 19th International Conference on Computer and Information Technology (ICCIT) 2016. We collected and added 130 more data to enrich our sample size and now, our total sample size is 917 which was 787 in the previous one. Moreover, we performed some significant statistical analysis like finding sensitivity, specificity, positive predictive value, and f-score here in this paper which were not in the earlier one. We surveyed more relevant literature and also compared our existing system with c4.5 algorithm.
2. Related Works
In order to identify risk factors for coronary heart disease (CHD), in [6], the authors introduced a coronary diseases prediction strategy using categorical feature, where blood pressure and dyslipidemia were categorized and correlated with the threat of coronary heart disease. They set a community based group to collect data and provide feedback after analyzing that data. Their total sample size was 5345. Throughout the twelve years of follow-up a total of 383 men and 227 women were found who had CHD. Multivariate logistic regression was used to predict the CHD as well as identify the risk factors. Sex-specific prediction equations were formulated to predict CHD. In case of middle aged white population sample, their suggested strategies can predict CHD risk effectively.
In [7], the researchers proposed a model to predict CHD risks perfectly. They developed Framingham functions and compared it with the performance of risk functions, originally developed from the individual clinical data. Cox regression coefficients and chi-square test as statistical measures were used in their methodology. The Framingham functions achieved good result for both black and white men and women. This event was taken within 5 years of follow up.
In [8], the scientists studied how mobile health can play significant role in prevention of cardiovascular disease. After that study, the team represented many statistics and provided some ideas how mobile health (mHealth) can prevent cardio vascular disease. They recommend some future research such as mobile application for treating obesity encouraging regular physical activity, smoking cessation, control of hypertension and dyslipidemia; and treating diabetes mellitus.
In [9], the researchers used different classification algorithm such as Decision Trees, Naive Bayes and K Nearest Neighbor in their research. For their analysis they used UCI machine learning database and WEKA (Waikato Environment for Knowledge Analysis), a data mining tool developed by the University of Waikato, New Zealand. Now, WEKA is really a popular suite of machine learning software. The experimental result showed that their true positive rate and accuracy is very good. In case of Naive Bayes algorithm they got 84.2% accuracy and sensitivity.
A system that can automatically predict heart disease was proposed in [10]. They used Decision Tree (C4.5) based algorithm for heart disease prediction. They used Cleveland heart disease dataset in their system which is available in UCI machine learning repository. They had designed a system that can efficiently predict the risk level of patients based on the given parameter about their health. The performance of their system was evaluated in terms of classification accuracy and the results showed that the system has great potential in predicting the heart disease risk level more accurately. They had used KEEL (Knowledge Extraction based on Evolutionary Learning) tool for prediction.
In [11], the scientists used several data mining techniques to predict heart disease. In their system, they implemented Decision Tree, Neural Network and Naive Bayes to find out interesting patterns from data collected from heart patients. For attribute selection they used Best first search and used WEKA as data mining tool. WEKA workbench contains a collection of visualization tools and various machine learning algorithms for data analysis. From Naive Bayes algorithm they got 82.914% accuracy with all attributes and 82.077% with selected attributes.
In [12], the authors presented that up to 75% of Cardiovascular diseases (CVD) in diabetes can be attributable to hypertension. In that paper, they also showed that atherosclerosis, dyslipidemia, micro-albuminuria, endothelial dysfunction, platelet hyperaggregability, coagulation abnormalities, obesity and diabetic are most important risk factors responsible for heart disease.
3. Methodology
Data of 917 patients was collected, where, there were 636 patients admitted in two cardiac hospitals with symptoms like chest pain, dyspnea, palpitations and syncope and remainder 281 individuals’ data was collected from health camps irrespective of their symptoms and presence of IHD. The above mentioned symptoms are suggestive of underlying diagnosis of IHD. In Figure 1 the overall analysis flowchart has been represented and the existing system’s architecture [1] of mobile application has been shown in Figure 2 and Figure 3. Here, a total number of 70 attributes have collected.
The variables analyzed for the purpose of this study were
age, gender, presence or absence of hypertension, diabetes,
dyslipidemia, smoking status, a significant family history [13],
habit of exercise, abnormal ECG, positive ETT, presence or absence of symptoms suggestive of IHD were considered which are shown in Figure 4 and Figure 5. Chi square test, fisher’s exact test, probability, percentage and ratios were used to calculate risk score. The data and generated risk score tree have been integrated to the android application named PredictRisk. In the application, the risk has been categorized as per score generated for variables of risk factors but if the user gives an input of having one or more symptoms, the risk level ascends up by one. This is designed to avoid bias of not having known about presence of diabetes and/or hypertension. The mobile screen shots with active application PredictRisk as shown in Figure 6 to Figure 11.
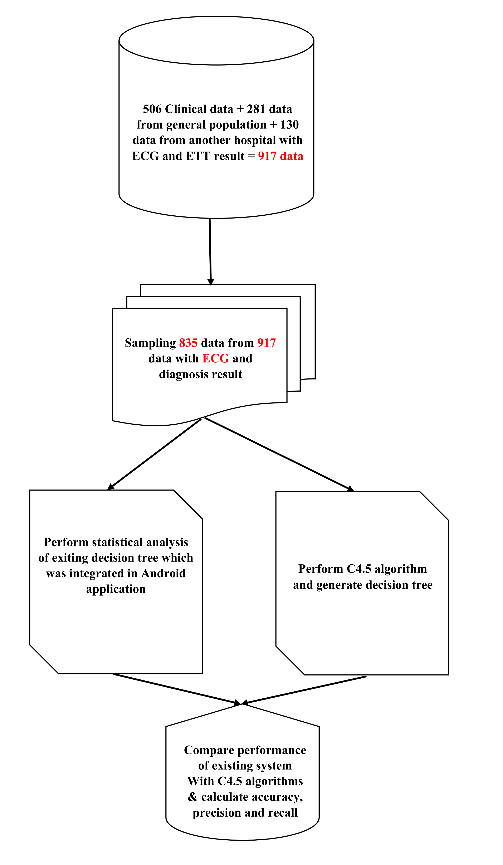 Figure 1: Overall Analysis
3.1. Chi-square test and Fisher’s exact test
For nominal data correlation between two attributes can be discovered by chi-square test. If A has c distinct values, namely a1, a2, ……. , ac and B has r distinct values namely b1, b2, …….. , br, the data tuples cn can be shown as table, where with the c values of A making up the columns and the r values of B making up the rows [14] [15]. The value (also known as Pearson chi-square statistic) is computed as [14]:
Fisher’s exact test is a statistical significance test used in the analysis of contingency tables. For fisher’s exact test the p is calculated as [1] [16] [17]:
3.2. Risk Score Calculation
One of the risk factors, Age, was sub-categorized into four and given scores based on level of significance and association with having heart attack. In our dataset, 62.5% Age is greater or equal to 55 years and out of that heart attack yes is 75.3%. This experimental result has been shown in Figure 12. So we have given the highest score 4 for this sub category. Our highest category Age has 4 subcategories and we have given score 1 for the age range 15-30, 2 for the age range 30-40, 3 for the age range 40-55 and 4 for the age greater or equal to 55 based on ratios and percentage with respect to heart attack.
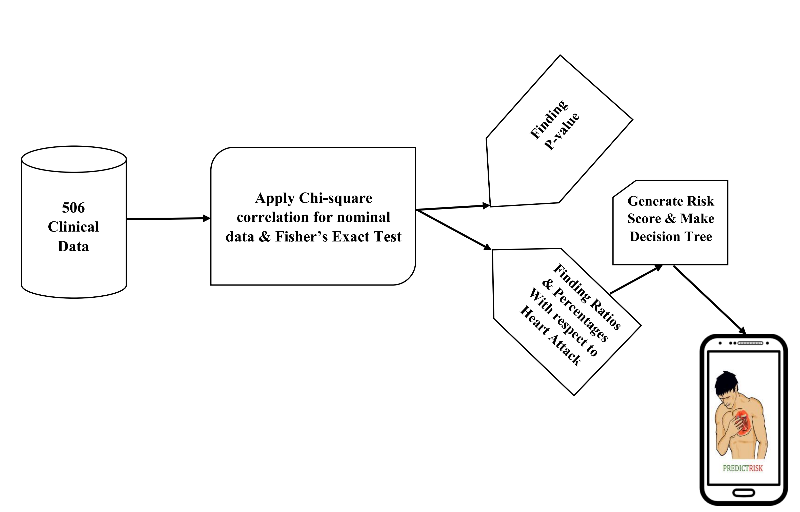 Figure 2: System Architecture of existing system
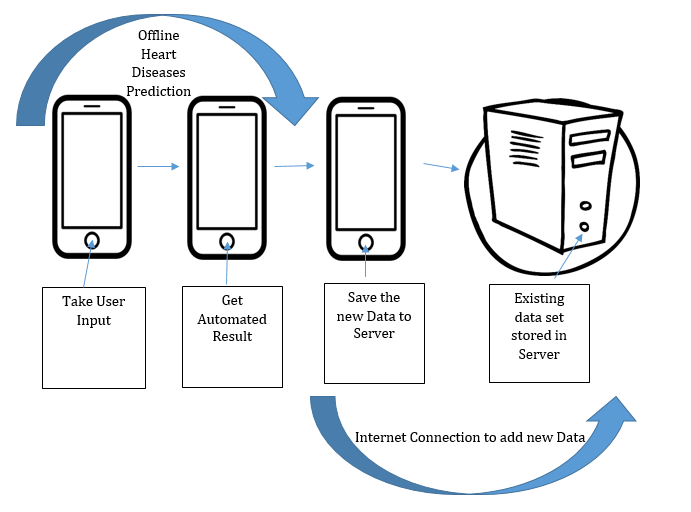 Figure 3: Android application process
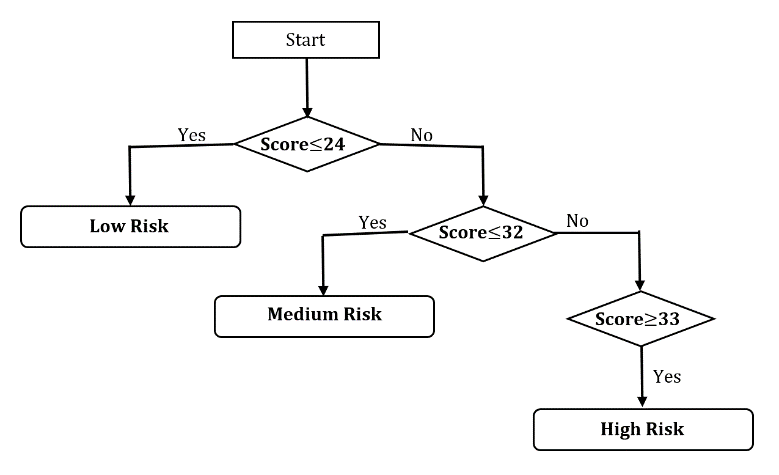 Figure 4: Risk Score tree
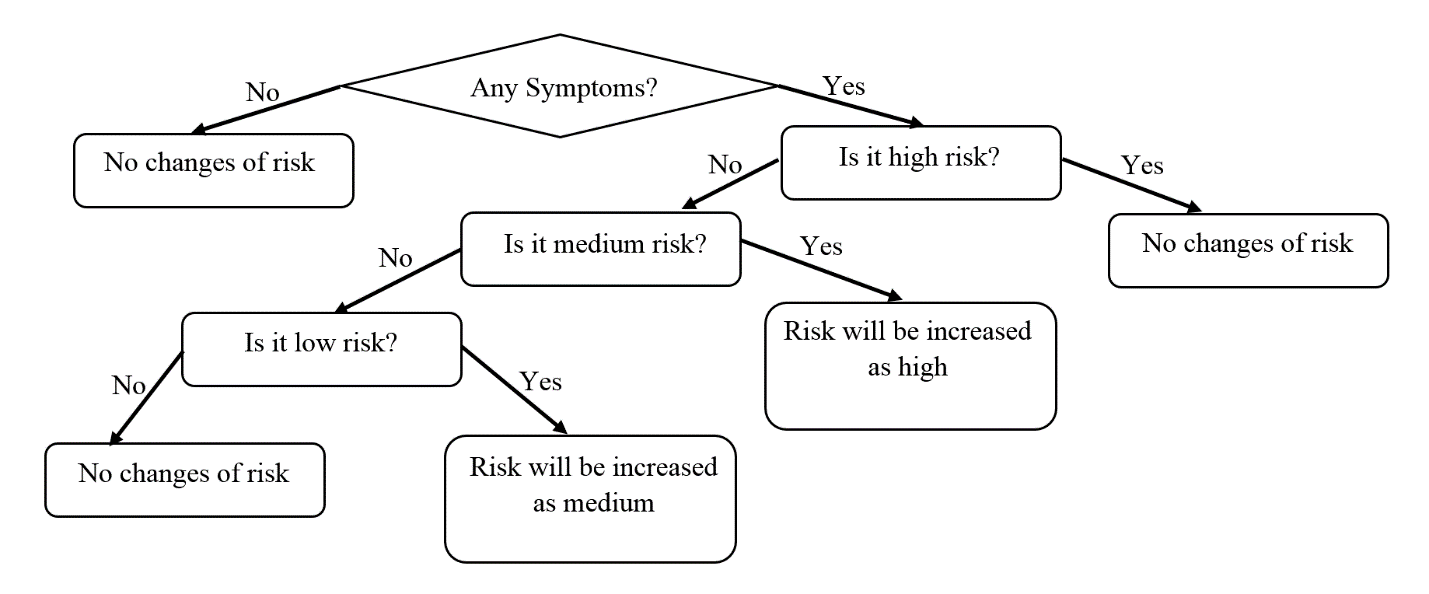 Figure 5: Symptom tree
 Figure 6: Application screen shot 1
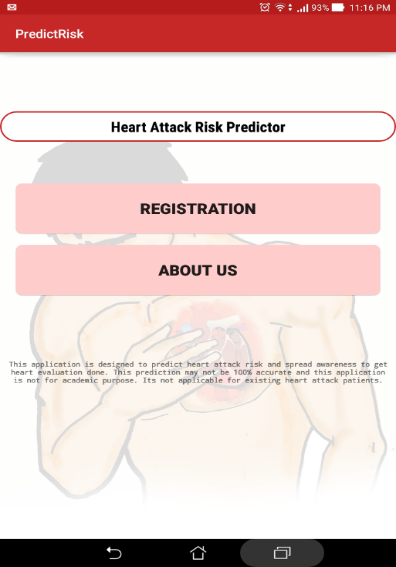 Figure 7: Application screen shot 2
 Figure 8: Application screen shot 3
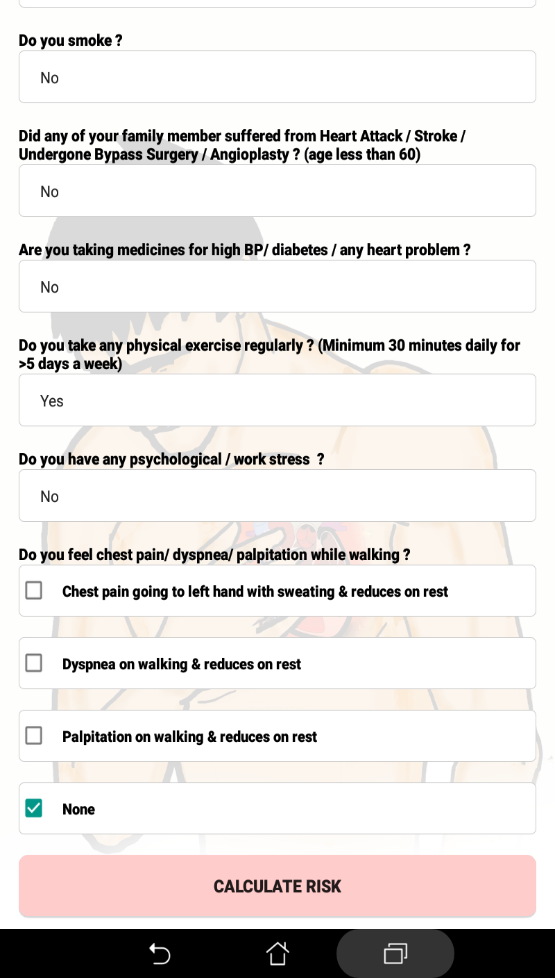 Figure 9: Application screen shot 4
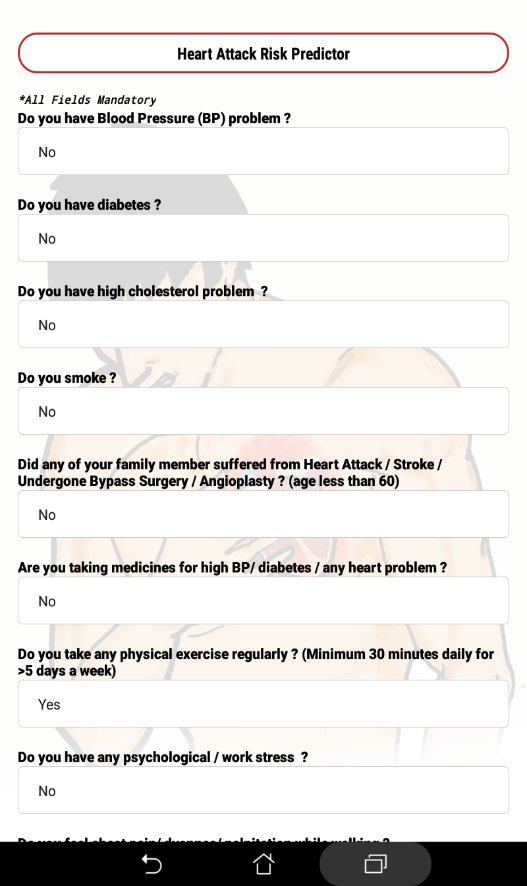 Figure 10: Application screen shot 5
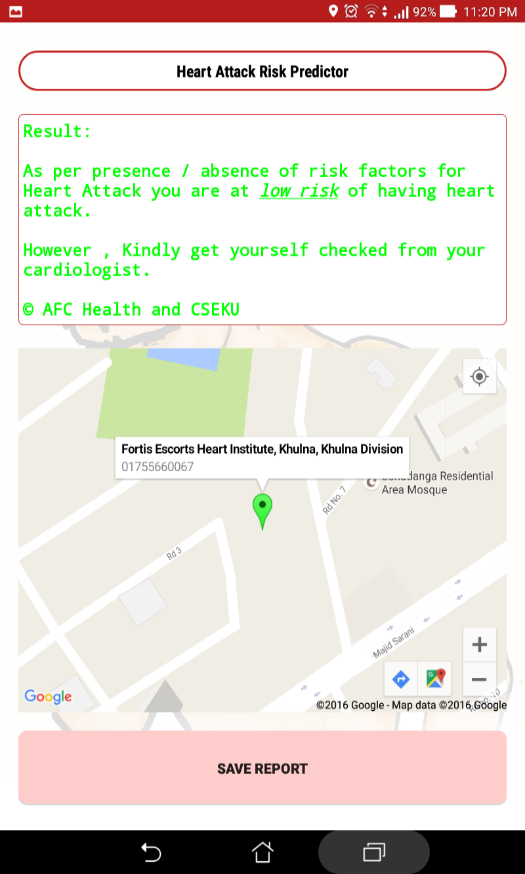 Figure 11: Application screen shot 6
- Confusion Matrix
The confusion matrix is an appropriate tool for analyzing how well your classifier can identify tuples of different classes has been shown in Table 2. TP (true positive) and TN (true negative) tell us when the classifier is getting things right, while FP (false positive) and FN (false negative) tell us when the classifier is getting things wrong [14] [15] [18].
- Statistical Metrics for Evaluating Classifier Performance
Statistical metrics such as sensitivity, specificity, accuracy, precision etc. are very significant to evaluate a classifier performance [14]. In this research paper we used sensitivity, specificity, accuracy, positive predictive value (PPV), F-measure, negative predictive value (NPV) as measurement.
- Sensitivity: The sensitivity or true positive rate or recall of an experimental test refers to the ability of the test to correctly identify those patients with the disease [19] [20] [21].
Sensitivity =
- Specificity: The specificity or true negative rate of a medical test refers to the ability of the test to correctly identify those patients without the disease [14] [20].
Specificity =
- Positive Predictive Value (PPV): The Positive Predictive Value (PPV) or Precision can be thought of as a measure of exactness [14] [19]. The PPV answers the question: ‘How likely is it that this patient has the disease given that the test result is positive’[20].
PPV =
- Negative Predictive Value (NPV): NPV is the percentage of patients with a negative test who do not have the disease [19].
NPV =
- Accuracy: The accuracy of a classifier on a given test set is the percentage of test set tuples that are correctly classified by the classifier [14] [15] [21].
Accuracy =
- Error rate: the error rate or misclassification rate of a classifier which is simply calculated as [1][19][21]:
Error rate = 1 – Accuracy
- F-measure: F-measure or F-score is the harmonic mean of precision and recall [14].
F-Score =
Table 1: Risk Score
| Attribute | Subcategory | Score |
| Age | 15-30 | 1 |
| 30-40 | 2 | |
| 40-55 | 3 | |
| Above>=55 | 4 | |
| Sex | female | 2 |
| male | 4 | |
| Smoking | yes | 4 |
| ex | 3 | |
| no | 1 | |
| HTN | no | 2 |
| yes | 4 | |
| DLP | no | 2 |
| yes | 4 | |
| DM | no | 2 |
| yes | 4 | |
| Physical Exercise | no | 4 |
| yes | 1 | |
| Family History | no | 2 |
| yes | 4 | |
| Drug History | no | 2 |
| yes | 4 | |
| Psychological Stress | no | 2 |
| yes | 4 |
Table 2: Confusion Matrix
| Predicted Class | ||||
| Actual Class | yes | no | Total | |
| yes | TP | FN | P | |
| no | FP | TN | N | |
| Total | Pˊ | Nˊ | P+N | |
3.5. C4.5 Decision Tree
C4.5 constructs a classifier in the form of a decision tree. In order to do this, C4.5 is given a set of data representing things that are already classified [22] [23] [24]. A classifier is a tool in data mining that takes a bunch of data representing things we want to classify and attempts to predict which class the new data belongs to [14].
Pseudo code of C4.5 decision tree [23] [25] [26]:
- Check for base cases
- For each attribute a : Find the normalized information gain ratio from splitting on a
- Let a_best be the attribute with the highest normalized information gain
- Create a decision node that splits on a_best
- Recur on the sublists obtained by splitting on a_best, and add those nodes as children of node
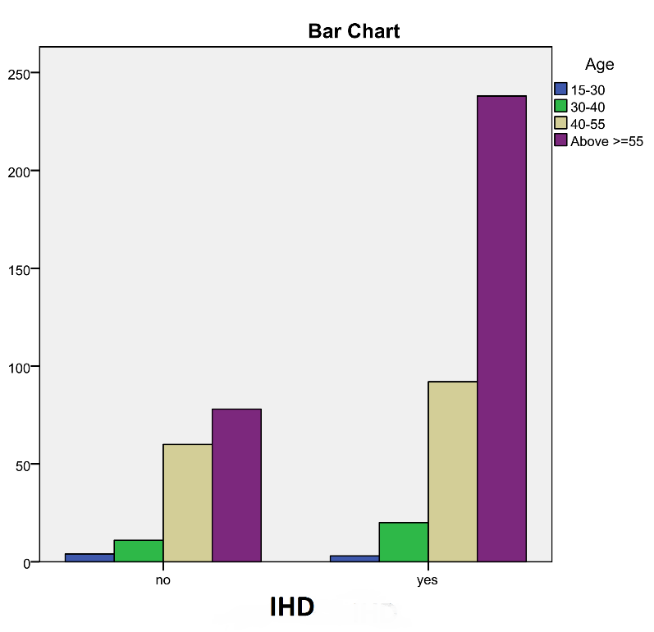 Figure 12: Bar chart between Age and IHD
4. Experimental Results and Statistical Analysis
We calculated the significance level between IHD and risk type (app result).We had 3 categories in risk types: high, low and medium.
- Significance level of IHD & Risk Type:
Here, the association between presence or absence of IHD and risk type (high & low) have been considered to be extremely statistically significant at 5% significance level [1] [16] [27].We used fisher’s exact test to calculate the p value.
Table 3: Confusion Matrix IHD*Risk (High & Low)
| Risk Type (App Result) | P-Value | ||||
| IHD | High | Low | Total | 0.0001<0.05
significant |
|
| Yes | 271 | 53 | 324 | ||
| No | 75 | 123 | 198 | ||
| Total | 346 | 176 | 522 | ||
Table 4: Confusion Matrix IHD*Risk (High & Medium)
| Risk Type (App Result) | P-Value | ||||
| IHD | High | Medium | Total | 0.0001<0.05
significant |
|
| Yes | 271 | 179 | 450 | ||
| No | 75 | 134 | 209 | ||
| Total | 346 | 313 | 659 | ||
Table 5: Confusion Matrix IHD*Risk (Medium & Low)
| Risk Type (App Result) | P-Value | ||||
| IHD | Medium | Low | Total | 0.0001<0.05
significant |
|
| Yes | 179 | 53 | 232 | ||
| No | 134 | 123 | 257 | ||
| Total | 313 | 176 | 489 | ||
The association between presence or absence of IHD and risk category high & medium and medium & low is considered to be extremely statistically significant at 5% significance level as shown in Table 4 to Table 6.Bar chart between IHD, ECG and risk category was shown in Figure 13 and Figure 14.
Table 6: Chi Square Test between IHD and Risk Type
| Value | df | Asymptotic Significance (2-sided) | |
| Pearson Chi-Square | 115.150 | 2 | .000 |
| Likelihood Ratio | 117.744 | 2 | .000 |
| N of Valid Cases | 835 |
- Statistical Measurements
By analyzing 835 clinical data we calculated number of TP, FP, FN and TN as shown in Table 7. Accuracy, sensitivity, specificity, f-score, error rate and precision of our existing system as shown in Table 8 were calculated.
Table 7: Confusion Matrix of Existing System
| Predicted Class | ||||
| Actual Class | yes | no | Total | |
| yes | 523 | 63 | 586 | |
| no | 137 | 112 | 249 | |
| Total | 660 | 175 | 835 | |
Table 8: Statistical Measurement of Existing System
| Statistic | Formula | Value |
| Sensitivity | TP/(TP+FN) | 89.25% |
| Accuracy | (TP+TN)/(P+N) | 76.05% |
| Error Rate | 1-accuracy | 23.95% |
| Specificity | TN/(FP+TN) | 44.98% |
| PPV | TP/(TP+FP) | 79.24% |
| NPV | TN/(FN+TN) | 64.00% |
We found, sensitivity was 89.25% and specificity was 44.98%. Under the category high 53.9% had IHD, under low 10.5% had IHD while under medium category 35.6% had IHD.
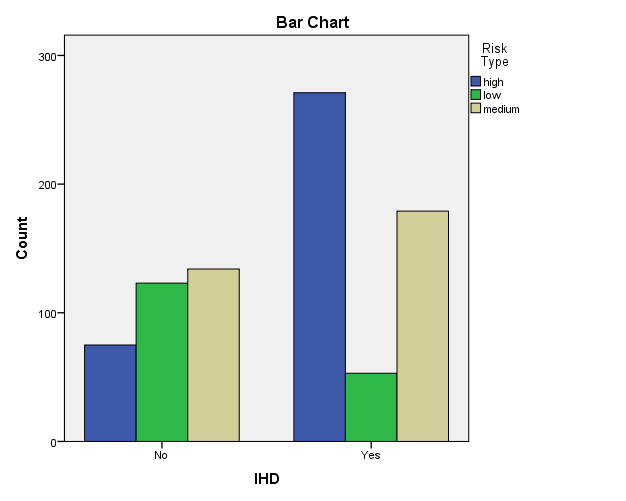 Figure 13: Bar chart between IHD and Risk Type
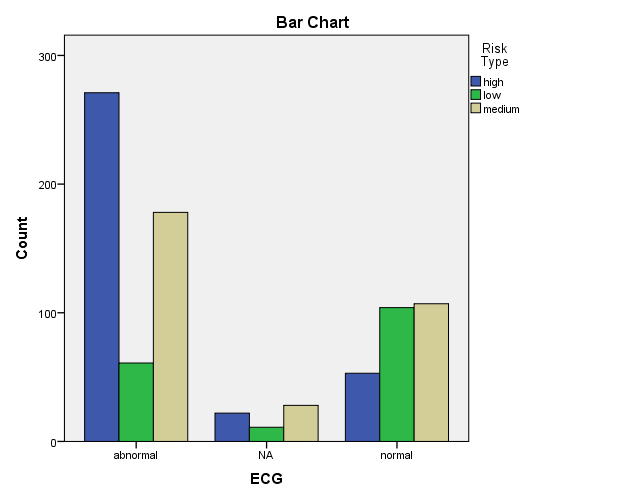 Figure 14: Bar chart between ECG and Risk Type
- 5 Decision Tree
We used WEKA data mining tool to apply C4.5 on our clinical data [28]. By applying C4.5 algorithm our decision tree looks like this:
ECG = abnormal: Yes
ECG = normal
| Chest Pain = yes
| | Risk Type = medium: No
| | Risk Type = high
| | | Dyspnea = no: No
| | | Dyspnea = yes: Yes
| | Risk Type = low: No
| Chest Pain = no: No
Here IHD is the output class. We use 70% data as training set and 30% for test set. The results of C4.5 are shown in Table 8 and confusion matrix in Table 9.We got 86% accuracy and 91.6% sensitivity from C4.5 algorithm.
Table 9: Statistical results of C4.5
| Precision | Recall | F-Measure | ROC Area | Class | |
| 0.865 | 0.916 | 0.89 | 0.852 | Yes | |
| 0.851 | 0.771 | 0.809 | 0.852 | No | |
| Weighted Average | 0.859 | 0.86 | 0.859 | 0.852 |
Table 9: Confusion Matrix
| Yes | No | |
| Yes | 141 | 13 |
| No | 22 | 74 |
From C4.5 algorithm number of correctly classified instances are 215 and number of incorrectly classified instances are 35. Mean absolute error is 0.2702.
5. Conclusion
IHD is a major killer worldwide. Using data generated from health care systems and mining them leads to development of mobile applications which are being used for predicting health and health related issues. PredictRisk categorizes the risk into clinically and socially acceptable parameters. PredictRisk generates and spreads awareness on the prevention and control of risk factors leading to IHD. In experimental analysis significant results have been found among the compared groups and users will be benefited heavily if this app will available in open source platform. Our research is motivated to make simple approach to detect the IHD risk and aware the population to get themselves evaluated by a cardiologist to avoid sudden deaths and morbidities.
Currently available tools have mandatory input of lipid values which makes them underutilized by population; though, those risk calculators bear excellent academic importance. Our research application PredictRisk reduces this limitation and promotes a risk evaluation on time.
Our future target is to collect more patients’ data who are admitted in hospitals with heart disease and analyzed then using deep learning techniques. Moreover, our approach does not work well when the risks belong to the medium category, so we would like to work more to improve this section also.
- Raihan, S. Mondal, A. More, M. Sagor, G. Sikder, M. Majumder, M. Al Manjur and K. Ghosh, “Smartphone Based Ischemic Heart Disease (Heart Attack) Risk Prediction using Clinical Data and Data Mining Approaches, a Prototype Design”, in 19th International Conference on Computer and Information Technology, North South University, Dhaka, Bangladesh, 2016, pp. 299-303.
- “Coronary Heart Disease in Bangladesh”, World Life Expectancy, 2014. [Online]. Available: http://www.worldlifeexpectancy.com/bangladesh-coronary-heart-disease.
- Abu Sayeed, H. Mahtab, S. Sayeed, T. Begum, P. Khanam and A. Banu, ”Prevalence and risk factors of coronary heart disease in a rural population of Bangladesh”, Ibrahim Med. Coll. J., vol. 4, no. 2, 2010.
- Islam and A. Majumder, “Coronary artery disease in Bangladesh: A review”, Indian Heart Journal, vol. 65, no. 4, pp. 424-435, 2013.
- “Risk assessment tool for estimating a patient’s 10-year risk of developing cardiovascular disease”, Patient Monitoring and Support CVD Risk Check. [Online].Available:https://www.cvdriskchecksecure.com/framinghamriskscore.aspx.
- Wilson, R. D’Agostino, D. Levy, A. Belanger, H. Silbershatz and W. Kannel, “Prediction of Coronary Heart Disease Using Risk Factor Categories”, Circulation, vol. 97, no. 18, pp. 1837-1847, 1998.
- D’Agostino, Sr, S. Grundy, L. Sullivan, P. Wilson and for the CHD Risk Prediction Group, “Validation of the Framingham Coronary Heart Disease Prediction Scores”, JAMA, vol. 286, no. 2, p. 180, 2001.
- Burke, J. Ma, K. Azar, G. Bennett, E. Peterson, Y. Zheng, W. Riley, J. Stephens, S. Shah, B. Suffoletto, T. Turan, B. Spring, J. Steinberger and C. Quinn, “Current Science on Consumer Use of Mobile Health for Cardiovascular Disease Prevention”, Circulation, vol. 132, no. 12, pp. 1157-1213, 2015.
- Joshi and M. Nair, “Prediction of Heart Disease Using Classification Based Data Mining Techniques”, Computational Intelligence in Data Mining – Volume 2, pp. 503-511, 2014.
- Purushottam, K. Saxena and R. Sharma, “Efficient heart disease prediction system using decision tree”, International Conference on Computing, Communication & Automation, 2015.
- Shafique, F. Majeed, H. Qaiser and I. Ul Mustafa, “Data Mining in Healthcare for Heart Diseases”, International Journal of Innovation and Applied Studies, vol. 10, no. 4, pp. 1312-1322, 2015.
- Sowers, M. Epstein and E. Frohlich, “Diabetes, Hypertension, and Cardiovascular Disease: An Update”,Hypertension, vol. 37, no. 4, pp. 1053-1059, 2001.
- R. Kolber and C. Scrimshaw, “Family history of cardiovascular disease”, Canadian Family Physician, vol. 60, no. 11, p. 1016, 2014.
- Han, M. Kamber and J. Pei, Data mining. Amsterdam: Elsevier/Morgan Kaufmann, 2012.
- Tan, M. Steinbach and V. Kumar, Introduction to data mining, 1st ed. Dorling Kindersley: Pearson, 2015.
- Dorey, “In Brief: The P Value: What Is It and What Does It Tell You”, Clinical Orthopaedics and Related Research®, vol. 468, no. 8, pp. 2297-2298, 2010.
- Fisher’s exact test”, En.wikipedia.org. [Online]. Available: https://en.wikipedia.org/wiki/Fisher%27s_exact_test.
- Ab Rahman, Brief Guidelines for Methods and Statistics in Medical Research. Singapore: Springer Singapore, 2015.
- Parikh, A. Mathai, S. Parikh, G. Chandra Sekhar and R. Thomas, “Understanding and using sensitivity, specificity and predictive values”, Indian Journal of Ophthalmology, vol. 56, no. 1, p. 45, 2008.
- Lalkhen and A. McCluskey, “Clinical tests: sensitivity and specificity”, Continuing Education in Anaesthesia, Critical Care & Pain, vol. 8, no. 6, pp. 221-223, 2008.
- van Stralen, V. Stel, J. Reitsma, F. Dekker, C. Zoccali and K. Jager, “Diagnostic methods I: sensitivity, specificity, and other measures of accuracy”, Kidney International, vol. 75, no. 12, pp. 1257-1263, 2009.
- Joshi and M. Nair, “Prediction of Heart Disease Using Classification Based Data Mining Techniques”, Computational Intelligence in Data Mining – Volume 2, vol. 2, pp. 503-511, 2014.
- Sharma, K. Saxena and R. Sharma, “Heart Disease Prediction System Evaluation Using C4.5 Rules and Partial Tree”, Advances in Intelligent Systems and Computing, vol. 411, pp. 285-294, 2015.
- Gandhi and S. Singh, “Predictions in heart disease using techniques of data mining”, 2015 International Conference on Futuristic Trends on Computational Analysis and Knowledge Management (ABLAZE), pp. 520-525, 2015.
- “C4.5 algorithm”, wikipedia.org. [Online]. Available: https://en.wikipedia.org/wiki/C4.5_algorithm#cite_note-3.
- Kotsiantis, “Supervised Machine Learning: A Review of Classification Techniques”, Informatica (Slovenia), vol. 31, no. 3, pp. 249-268, 2007.
- More, M. Raihan, M. Sagor, G. Sikder, S. Mondal and M. Manjur, “Smartphone Based “Heart Attack” Risk Prediction; Initiation of A Clinically Simple Approach”, Journal of Hypertension, vol. 34, p. e274, 2016.
- Witten, E. Frank and M. Hall, Data mining. Burlington, MA: Morgan Kaufmann, 2011.