Efficiency Comparison in Prediction of Normalization with Data Mining Classification

Adv. Sci. Technol. Eng. Syst. J. 6(4), 130–137 (2021);
 DOI: 10.25046/aj060415
In research project, efficiency comparison study in prediction of normalization with data mining classification. The purpose of the research was to compare three normalization methods in term of classification accuracy that the normalized data provided: Z-Score, Decimal Scaling and Statistical Column. The six known classifications: K-Nearest Neighbor, Decision Tree, Artificial Neural Network, Support Vector Machine, Naïve Bayes, and Binary Logistic Regression were used to evaluate the normalization methods. The six studied data sets were into two groups. Those data sets were data sets of White wine quality, Pima Indians diabetes, and Vertebral column of which data were 1-5 variables of the outlier coefficient of variation and data sets of Indian liver disease, Working hours, and Avocado of which data were 6-10 variables of the outlier coefficient of variation. The result of comparison White wine quality and Vertebral column, the best efficiency method had many methods in a non-systematic way. For the data set of Pima Indians diabetes and Indian liver disease, Statistical Column and classification by K-Nearest Neighbor was the best efficiency. For the data set of Working hours, Decimal Scaling and classification by K-Nearest Neighbor was the best efficiency. For the data set of Avocado, Statistical Column and classification by K-Nearest Neighbor, Z-Score and Decimal Scaling and classification by Binary Logistic Regression were the best efficiency. All of normalization and classification methods, Statistical Column and classification by K-Nearest Neighbor was the best efficiency by precision.
1. Introduction
Nowadays, advances in information technology have conveyed to the storing of large amount of data. However, most of data usage is still extracting data from database. The knowledge gained from this data analysis can be of great use in organizational operations and decision making. Data mining can be operated in many forms depending on the objective of data mining. Classification is a modeling for categorical data from pre-classified data to use that model to classify new data that has not previously been classified [1]. In addition, data mining is a method of extracting knowledge from different data to utilize that knowledge in decision making. Such knowledge may be used to predict or create models for classifying or displaying relationships between different units, which data mining can be applied in many organizations, for example: finance, insurance, medical, etc. Today there is a lot of interesting research or exploration. In the process of working on those researches, researchers often use statistical methods to analyze data and draw conclusions for those researches in further revision or development. In order to obtain data, the data collected can be disorganized, often causing problems. Each variable has different values ranging from little, medium, and very different. If those data were analyzed, the result would be differed from the truth. As a result, the assumptions were not met and the data could not be used in the best way. One way to manage this problem is transformation or normalization, using a simple mathematical method to adapt the collected data to a new and standardized form, for example: Z-Score, Median, Min-Max, Decimal Scaling and Statistical Column [2].
From the first literature review, in Malaysia, there is investigate the use of three normalizations in prediction of degue, for example: Min-Max, Z-Score and Decima Scaling. These methods in prediction model are consisted of Support Vector Machine (SVM) and Artificial Neural Network (ANN). The comparison results considered the accuracy of prediction and mean square error (MSE). The results show that SVM and ANN had the maximum accuracy and the minimum MSE for Decimal Scaling, Min-Max, and Z-Score respectively. Nevertheless, SVM is a better prediction as compared to the ANN [3]. The second, comparative analysis of K-Nearest Neighbor (KNN) with various k using Min-Max and Z-Score with R programming. The average accuracy was about 88% for Min-Max and 79% for Z-Score [4]. Finally, the efficiency of normalizations was compared. The main objective of this research was to compare four normalization methods in terms of classification accuracy that the normalized data provided. Those methods were the following: Min-Max, Z-Score, Decimal Scaling, and Median. Four data sets and three classifications by K-NN, Naïve Bayes, and ANN were used to evaluate the normalization methods. For the conclusion of the dataset of White wine quality, normalization by Decimal Scaling and classification by K-NN were the best combination. For the dataset of Pima Indians diabetes, normalization by Decimal Scaling and classification by ANN were the best combination. For the dataset of Vertebral column, normalization by Decimal Scaling and classification by K-NN were the best combination. For the dataset of Indian liver patient, normalization by Decimal Scaling and classification by Naïve Bayes were the best combination. We assume that the best normalization method was the Decimal Scaling and classification by K-NN [5].
In this research, three normalizations were studied; Z-Score, Decimal Scaling, and Statistical Column and were carried out with four classification methods which were regularly use; K-NN, Decision Tree, ANN and SVM. The other two proposed classification methods were Naïve Bayes and Binary Logistic Regression to compared the most accuracy efficiency in prediction of normalization with classification by R programming.
2. Experimental Methods
The experimental methods are systematic and scientific approach to research. Here, they consisted of data collection and research procedures [5].
2.1. Data Collection
Data collection is three step methods: gathering, measuring and analyzing the accuracy of the data for research by standard checked methods [5]. Six secondary data sets were collected from website UCI.com, Kaggle.com and Mldata.com as followed:
- White wine quality, total number of data 1,500 values with 1-5 variables of the outlier coefficient of variation [6].
- Pima Indians diabetes, total number of data 768 values with 1-5 variables of the outlier coefficient of variation [7].
- Vertebral column, total number of data 310 values with 1-5 variables of the outlier coefficient of variation [8].
- Indian liver patient, total number of data 575 values with 6-10 variables of the outlier coefficient of variation [9].
- Working hours, total number of data 956 values with 6-10 variables of the outlier coefficient of variatio.n
- Avocado, total number of data 1,149 values with 6-10 variables of the outlier coefficient of variation [11].
The data set consisted of 2 parts: data sets 1-3 contained 1-5 variables of the outlier coefficient of variation and data sets 4-6 contained 6-10 variables of the outlier coefficient of variation.
2.2. Research Procedures
Research procedures are the specific methodology or techniques used to identify, select, process, and analyze information [5]. Here, they consisted of normalization, data sets partitioning method, data analysis and efficiency comparison in prediction of classification.
2.2.1. Normalization
Z-Score using R program, Decimal Scaling and Statistical Column using Excel program were performed normalization.
2.2.2. Data Sets Partitioning Method
Dividing the data set into 2 sets and randomly 5 rounds by specifying the random seed as 10, 20, 30, 40 and 50 in the ratio of 70:30 which is commonly used in the data mining research. Part 1, training data set was applied to build a model by 70 percent. For part 2, testing data set was applied to test a model by 30 percent [12]-[16] as followed in table 1.
Table 1: Result of six data sets partition.
| Data set | Total number of data set | Total number of training data set (70 percent) | Total number of testing data set (30 percent) |
| White wine
Quality
|
1,500 |
1,050 |
450 |
| Pima Indian
diabetes
|
768 |
537 |
231 |
| Vertebral column |
310 |
217 |
93 |
| Indian liver
Patient
|
575 |
402 |
173 |
| Working hours |
956 |
669 |
287 |
| Avocado
|
1,149 |
804 |
345 |
2.2.3. Data Analysis
Data analysis is the method of applying statistical data to describe, explain and appraise data [5].
2.2.3.1. Normalization
Normalization is the method of improving values using measured on the different scale to the same scale. It permits analogy of related values of different data. There are many normalizations, for example: Z-Score, Median, Min-Max, Decimal Scaling and Statistical Column. In this research, we interested in three normalizations as follows [4].
1) Z-Score Normalization
This method, the data are subtracted from the mean and divided by the standard deviation of sample for every style on training data to transform each input style into the new data . The normalization formula is as follows [17];
![]() 2) Decimal Scaling Normalization
2) Decimal Scaling Normalization
The decimal scaling normalization method transforms the original value of the data as a decimal number. The decimal position is defined by the maximum absolute value as follows [18].
![]() where j is the number of positions of the largest value.
where j is the number of positions of the largest value.
3) Statistical Column Normalization
The statistical column normalization method transforms every column with a normalized column value, . Compute the normalization of every column by subtracting the data with a normalized column value to a length of one. Then, compute every column by dividing a normalized column value and multiplied by 0.1 which is biased as follows. [17]
![]() 2.2.3.2. Classification
2.2.3.2. Classification
Classification is the method of specifying and managing individual values into a set. Then, it is applied to predict a model of testing data after training data as follows [4].
1) K-Nearest Neighbor
K-Nearest Neighbor (KNN) is a very popular method as it is a simple and effective method that can be used to many tasks such as classification and missing value replacement. It uses the IBk algorithm [19]. The first, the data set must be prepared and scaled into a normalized scale. Then, the Euclidean distance is computed between two points [4].
2) Decision Tree
The tree used in decision support is an upside-down tree structure with roots at the top and leaves at the bottom. Within the tree there are nodes, each of which represents a decision based on the attributes. The branches of the tree represent the values or results obtained from the test, and the leaves at the bottom of the decision tree represent class or results. The top node is called the root node. Here, the decision tree decided to use the J48 (C4.5) algorithm [20].
3) Artificial Neural Network
Artificial Neural Network (ANN) is technology developed from artificial intelligence research to calculation of function values from data groups. ANN is the method for machines to learn from a prototype and then train the system to think and solve broader problems. The structure of ANN consists of input and output node. Processing is distributed in a layered structure, namely input, output and hidden layer. ANN processing relies on the transmission of work through the nodes of these layers. Here, the ANN decided to use the Multilayer Perceptron algorithm [21], [22].
4) Support Vector Machine
The goal of this method is a supervised learning that a highly general classiflier can be built. That is, it can be work well with unknown database with the data formatting process from the low dimensional data set on the input space is in the high dimensional data set on the feature space using a function to format the data, known as the kernel function. This capability makes it easier to construct a quadratic data classiflier on a feature space for classification. In addition, a good classiflier should have a linear structure and be able to create the distance area between the classiflier and the closest value of each group to be effective in separating each type of data set from one another. The appropriate line is called the optimal separating hyperplane. Here, the support vector machine decided to use the Sequential Minimal Optimization (SMO) algorithm [18].
5) Naïve Bayes
The first proposed classification method was Naïve Bayes. It will use an analysis of the probability of things that have not happened before, based on the predictions of what has happened before. A simple form of relationships is as follows [23];
![]() From Bayes equation, if one is to predict the class C when attribute A is known, it can be calculated from the probability of attribute A with the class C in training data set and probability of attribute A and class C.
From Bayes equation, if one is to predict the class C when attribute A is known, it can be calculated from the probability of attribute A with the class C in training data set and probability of attribute A and class C.
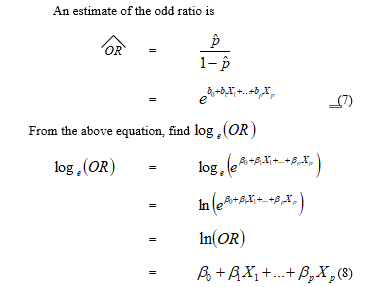
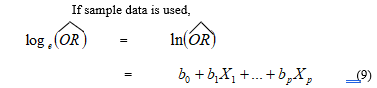
6) Binary Logistic Regression
The second proposed classification method was Binary logistic regression. It is a regression analysis in which the dependent variable is a qualitative variable with only two values while the independent variable can be either a quantitative or a qualitative variable, or may be both a quantitative and qualitative variable. The binary logistic regression analysis method has no distribution conditions for independent variables, and there is no conditions of the variance and covariance matrix for each group, and this method predicts probabilities that each unit is in a specific group [24];
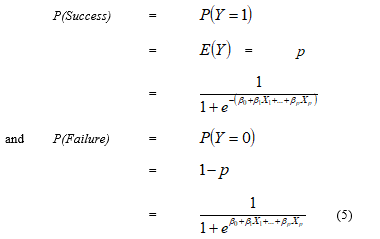 From the above equation, the relationship between the independent and the dependent variables is nonlinear. Therefore, the relationship is adjusted in a linear form as follows:
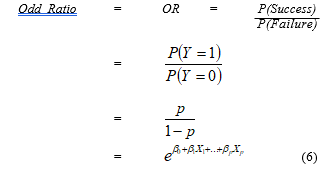 If the odd ratio is greater than 1, then the probability of an event of success is greater than an event of failure.
 The right hand side of the above equation is in a linear form, called the logit response function.
 2.2.4. Efficiency Comparison in Prediction of Classifications
The analysis results of three normalization methods were used by six classifications to compare the efficiency in prediction from the accuracy as follows:
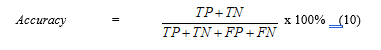 where True Positive (TP) is the number of exactly classified as positive, the real value is positive. True Negative (TN) is the number of exactly classified as negative, the real value is negative. False Positive (FP) is the number of mistakenly classified as positive, the real value is negative and False Negative (FN) is the number of mistakenly classified as negative, the real value is positive [25].
Flowchart showed the step of experimental methods as follows in figure 1. The process started from six secondary data sets were collected from website. Therefore, normalization is the method of improving values using measured on the different scale to the same scale. There are three normalizations, for example: Z-Score, Decimal Scaling and Statistical Column. After that, data set were divided into 2 sets and randomly 5 rounds by specifying the random seed as 10, 20, 30, 40 and 50 in the ratio of 70:30. Part 1 the training data was applied to built a model using 70 percent. For part 2 the testing data was applied to test a model using 30 percent. Then, classification was applied to predict a model of testing data after training data. Classification consisted of six methods, for example: K-Nearest Neighbor, Decision Tree, Artificial Neural Network, Support Vector Machine, Naïve Bayes and Binary Logistic Regression. Finally, the analysis results of three normalization methods were used by six classifications to compare the efficiency in prediction from the accuracy.
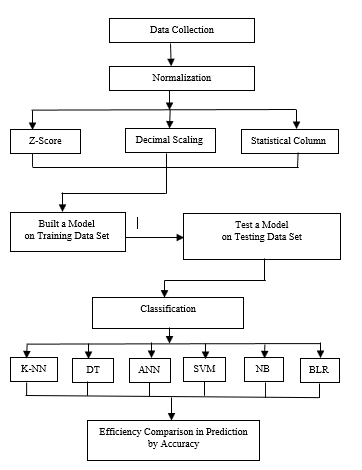 Figure 1: Flowchart of Experimental Methods
K-NN = K-Nearest Neighbor
DT = Decision Tree
ANN = Artificial Neural Network
SVM = Support Vector Machine
NB = Naïve Bayes
BLR = Binary Logistic Regression
3. Results and Discussions
3.1. White Wine Quality Data Set
As shown in Table 2, if Z-Score is used, classification by Decision Tree, Artificial Neural Network, Support Vector Machine and Binary Logistic Regression had the maximum accuracy at 100 percent. But if Decimal Scaling is used, classification by K-Nearest Neighbor, Decision Tree, Artificial Neural Network, Support Vector Machine and Binary Logistic Regression had the maximum accuracy at 100 percent. If Statistical Column is used, classification by K-Nearest Neighbor, Support Vector Machine and Binary Logistic Regression Binary Logistic Regression had the maximum accuracy at 100 percent.
Table 2: The results of efficiency comparison in white wine quality data using Z-Score, Decimal Scaling and Statistical Column with Classification for K-Nearest Neighbor, Decision Tree, Artificial Neural Network, Support Vector Machine, Naïve Bayes and Binary Logistic Regression.
| Classification | Normalization | ||
| Z-Score | Decimal Scaling | Statistical Column | |
| K-Nearest Neighbor | 93.4222 | 100 | 100 |
| Decision Tree
|
100 | 100 | 92 |
| Artificial Neural Network | 100 | 100 | 56.1231 |
| Support Vector Machine | 100 | 100 | 100 |
| Naïve Bayes
|
98.8446 | 99.0235 | 69.8728 |
| Binary Logistic Regression | 100 | 100 | 100 |
3.2. Pima Indians Diabetes Data Set
As shown in Table 3, if Z-Score is used, classification by Binary Logistic Regression had the maximum accuracy at 77.7320 percent. But if Decimal Scaling is used, classification by Decision Tree had the maximum accuracy at 79.2208 percent. If Statistical Column is used, classification by K-Nearest Neighbor had the maximum accuracy at 81.7316 percent. All the normalization and classification are compared, the Statistical Column Normalization and K-Nearest Neighbor classification had the maximum accuracy.
Table 3: The results of efficiency comparison in Pima Indians diabetes data using Z-Score, Decimal Scaling and Statistical Column with Classification for K-Nearest Neighbor, Decision Tree, Artificial Neural Network, Support Vector Machine, Naïve Bayes and Binary Logistic Regression.
| Classification | Normalization | ||
| Z-Score | Decimal Scaling | Statistical Column | |
| K-Nearest Neighbor | 68.4848 | 69.4373 | 81.7316 |
| Decision Tree
|
74.4589 | 79.2208 | 69.6969 |
| Artificial Neural Network | 77.0043 | 77.2824 | 65.3877 |
| Support Vector Machine | 76.9500 | 76.9500 | 67.8400 |
| Naïve Bayes
|
73.6111 | 64.4787 | 66.3375 |
| Binary Logistic Regression | 77.7320 | 72.2247 | 69.0573 |
3.3. Vertebral Column Data Set
As shown in Table 4, if Z-Score is used, classification by Binary Logistic Regression had the maximum accuracy at 86.5807 percent. But if Decimal Scaling and Statistical Column are used, classification by K-Nearest Neighbor and Decision Tree had the maximum accuracy at 100 percent. All the normalization and classification are compared, Decimal Scaling, Statistical Column Normalization and K-Nearest Neighbor classification or Decimal Scaling, Statistical Column Normalization and Decision Tree classification had the maximum accuracy.
Table 4: The results of efficiency comparison in Vertebral column data using Z-Score, Decimal Scaling and Statistical Column with Classification for K-Nearest Neighbor, Decision Tree, Artificial Neural Network, Support Machine, Naïve Bayes and Binary Logistic Regression.
| Classification | Normalization | ||
| Z-Score | Decimal Scaling | Statistical Column | |
| K-Nearest Neighbor | 81.9355 | 100 | 100 |
| Decision Tree
|
67.7419 | 100 | 100 |
| Artificial Neural Network | 83.4513 | 83.9367 | 80.5782 |
| Support Vector Machine | 76.9500 | 76.9500 | 67.8400 |
| Naïve Bayes
|
74.5348 | 76.6055 | 81.9705 |
| Binary Logistic Regression | 86.5807 | 73.9175 | 83.6670 |
3.4. Indian Liver Disease Data Set
As shown in Table 5, if Z-Score and Decimal Scaling are used, classification by Binary Logistic Regression had the maximum accuracy at 73.1029 and 73.1054 percent respectively. But if Statistical Column is used, classification by K-Nearest Neighbor had the maximum accuracy at 99.6531 percent. All the normalization and classification are compared, Statistical Column Normalization and K-Nearest Neighbor classification had the maximum accuracy.
Table 5: The results of efficiency comparison in Indian liver disease data using Z-Score, Decimal Scaling and Statistical Column with Classification for K-Nearest Neighbor, Decision Tree, Artificial Neural Network, Support Vector Machine, Naïve Bayes and Binary Logistic Regression
| Classification | Normalization | ||
| Z-Score | Decimal Scaling | Statistical Column | |
| K-Nearest Neighbor | 64.1619 | 61.3341 | 99.6531 |
| Decision Tree
|
68.2080 | 67.0520 | 69.3641 |
| Artificial Neural Network | 65.7435 | 70.2721 | 73.7657 |
| Support Vector Machine | 70.9700 | 70.9700 | 70.9700 |
| Naïve Bayes
|
63.2700 | 71.1385 | 60.9860 |
| Binary Logistic Regression | 73.1029 | 73.1054 | 72.9447 |
3.5. Working Hours Data Set
As shown in Table 6, if Z-Score and Statistical Column are used, classification by Naïve Bayes had the maximum accuracy at 79.5518 and 99.7138 percent respectively. But if Decimal Scaling is used, classification by K-Nearest Neighbor had the maximum accuracy at 100 percent. All the normalization and classification are compared, Decimal Scaling Normalization and K-Nearest Neighbor classification had the maximum accuracy.
Table 6: The results of efficiency comparison in Working hours data using Z-Score, Decimal Scaling and Statistical Column with Classification for K- Nearest Neighbor, Decision Tree, Artificial Neural Network, Support Vector Machine, Naïve Bayes and Binary Logistic Regression.
| Classification | Normalization | ||
| Z-Score | Decimal Scaling | Statistical Column | |
| K-Nearest Neighbor | 71.6376 | 100 | 99.5818 |
| Decision Tree
|
73.5191 | 73.5191 | 72.8223 |
| Artificial Neural Network | 78.1346 | 78.0755 | 54.1547 |
| Support Vector Machine | 74.6300 | 74.4800 | 65.5200 |
| Naïve Bayes
|
79.5518 | 78.8154 | 99.7138 |
| Binary Logistic Regression | 74.6093 | 74.9622 | 73.5478 |
3.6. Avocado Data Set
As shown in Table 7, if Z-Score and Decimal Scaling are used, classification by Binary Logistic Regression had the maximum accuracy at the same 100 percent. If Statistical Column is used, classification by K-Nearest Neighbor had the maximum accuracy at 100 percent. All the normalization and classification are compared, Statistical Column Normalization and K-Nearest Neighbor classification or Z-Score, Decimal Scaling Normalization and Binary Logistic Regression classification had the maximum accuracy.
Table 7: The results of efficiency comparison in Avocado data using Z-Score, Decimal Scaling and Statistical Column with Classification for K- Nearest Neighbor, Decision Tree, Artificial Neural Network, Support Vector Machine, Naïve Bayes and Binary Logistic Regression.
| Classification | Normalization | ||
| Z-Score | Decimal Scaling | Statistical Column | |
| K-Nearest Neighbor | 99.7101 | 85.3333 | 100 |
| Decision Tree
|
66.3768 | 66.3768 | 66.3768 |
| Artificial Neural Network | 99.2691 | 99.3303 | 99.4265 |
| Support Vector Machine | 96.0300 | 96.0300 | 99.6300 |
| Naïve Bayes
|
90.0744 | 89.4525 | 99.5136 |
| Binary Logistic Regression | 100 | 100 | 99.9748 |
The result of study of efficiency comparison in prediction of normalization with data mining classification for data set with 1-5 variables of the outlier coefficient of variation were White wine quality, Pima Indians diabetes and Vertebral column. The best efficiency method was Statistical Column Normalization and classification by K-Nearest Neighbor, and Decimal Scaling Normalization and classification by Decision Tree and K-Nearest Neighbor respectively. For the dataset with 6-10 variables of the outlier coefficient of variation were Indian liver disease, Working hours and Avocado. The best efficiency method is Statistical Column Normalization and classification by K-Nearest Neighbor and Decimal Scaling Normalization and classification by K-Nearest Neighbor respectively which was similar to the research of T. Malai et al. (2021) found that the best method was Decimal Scaling Normalization and classification by K-Nearest Neighbor.
Table 8: The results of efficiency comparison all data using Z-Score, Decimal Scaling and Statistical Column with Classification for K-Nearest Neighbor, Decision Tree, Artificial Neural Network, Support Vector Machine, Naïve Bayes and Binary Logistic Regression.
| Data | Classification | Normalization | ||
| Z-Score | Decimal Scaling | Statistical Column | ||
| White Wine Quality | – K-Nearest Neighbor
– Decision Tree – Artificial Neural Network – Support Vector Machine – Naïve Bayes – Binary Logistic Regression |
ü ü
ü
ü |
ü
ü ü
ü
ü |
ü
ü
ü |
| Pima Indians Diabetes | – K-Nearest Neighbor
– Decision Tree – Artificial Neural Network – Support Vector Machine – Naïve Bayes – Binary Logistic Regression |
ü | ||
| Vertebral Column | – K-Nearest Neighbor
– Decision Tree – Artificial Neural Network – Support Vector Machine – Naïve Bayes – Binary Logistic Regression |
ü
ü |
ü
ü |
|
| Indian Liver Disease | – K-Nearest Neighbor
– Decision Tree – Artificial Neural Network – Support Vector Machine – Naïve Bayes – Binary Logistic Regression |
ü | ||
| Working Hours
|
– K-Nearest Neighbor
– Decision Tree – Artificial Neural Network – Support Vector Machine – Naïve Bayes – Binary Logistic Regression |
ü | ||
| Avocado | – K-Nearest Neighbor
– Decision Tree – Artificial Neural Network – Support Vector Machine – Naïve Bayes – Binary Logistic Regression |
ü |
ü |
ü |
ü = the best accuracy for each data set
As shown in Table 8, White wine quality data set, the highest efficiency methods were Decimal Scaling, Statistical Column and classification by K-Nearest Neighbor; Z-Score, Decimal Scaling and classification by Decision Tree and Artificial Neural Network and Z-Score, Decimal Scaling, Statistical Column and classification by Support Vector Machine and Binary Logistic Regression. Pima Indians diabetes data set, the maximum efficiency method was Statistical Column and classification by K-Nearest Neighbor. Vertebral column data set, the maximum efficiency method was Decimal Scaling, Statistical Column and classification by K-Nearest Neighbor and Decision Tree. Indian liver disease data set, the maximum efficiency method was Statistical Column and classification by K-Nearest Neighbor. Working hours data set, the maximum efficiency method was Decimal Scaling and classification by K-Nearest Neighbor. Avocado data set, the maximum efficiency method was Statistical Column and classification by K-Nearest Neighbor. The another maximum efficiency methods were Z-Score, Decimal Scaling and classification by Binary Logistic Regression.
4. Conclusion
In summary, White wine quality data and Vertebral column data, the maximum efficiency method have many methods in a non-systematic way. Pima Indians diabetes data and Indian liver data, the maximum efficiency method was Statistical Column and classification by K-Nearest Neighbor. Vertebral column data, the maximum efficiency method was Decimal Scaling, Statistical Column and classification by K-Nearest Neighbor and Decision Tree. Working hours data, the maximum efficiency method was Decimal Scaling and classification by K-Nearest Neighbor. Avocado data, the maximum efficiency method was Statistical Column and classification by K-Nearest Neighbor and the another maximum efficiency methods were Z-Score, Decimal Scaling and classification by Binary Logistic Regression. All of normalization and classification methods, Statistical Column and classification by K-Nearest Neighbor was the best efficiency by precision. This finding of Statistical Column and classification by K-Nearest Neighbor can be applied in many fields of medical, public health and science in real world problem.
Conflict of Interest
The author announce no conflict of interest.
Acknowledgment
I thank the School of Science, King Mongkut’s Institute of Technology Ladkrabang for funding research project, help and support on efficiency comparison in prediction of normalization with data mining classification.
- S. Euawattanamongkol, Data mining, National Institute of Development Administration Publisher, 2016.
- N. Kratethong, Transformation to normal distribution, Master’s Degree Thesis in Statistics, Department of Statistics, Faculty of Commerce and Account, Chulalongkorn University, 1999.
- Z. Mustaffa, Y.A. Yusof, “Comparison of normalization techniques in predicting dengue outbreak,” in 2010 International Conference on Business and Economics Research, 1, 345-349, IACSIT Press, Kuala Lumpur, Malaysia, 2011.
- A. Pandey, A. Jain, “Comparative analysis of KNN algorithm using various normalization techniques,” International Journal Computer Network and Information Security, 11, 36-42, 2017, doi:10.5815/ijcnis.2017.11.04.
- T. Malai, P. Ninthanom, S. Sinsomboonthong, “Performance comparison of transformation methods in data mining classification technique,” Thai Journal of Science and Technology, 10(1), 510-522, 2021.
- P. Cortez, A. Cerdeira, F. Almeida, T. Matos, J. Reis, Wine quality data set, [Online], Available : https://archive.ics.uci.edu/ml/datasets/Wine+Quality, 2009.
- J.W. Smith, J.E. Everhart, W.C. Dickson, W.C. Knowler, R.S. Johannes, Pima Indians diabetes database, [Online], Available : https://www.kaggle.com/uciml/pima-indians-diabetes-database, 1988.
- H.D. Mota, Vertebral column data set, [Online], Available : https://www.kaggle.com/caesarlupum/vertebralcolumndataset, 2011.
- B.V. Ramana, Indian liver patient, [Online], Available : https://www.mldata.io/dataset-details/indian_liver_patient/, 2012.
- L. Myoung, Working hours, [Online], Available : https://rdrr.io/rforge/Ecdat/man/Workinghours.html, 1995.
- J. Kiggins, Avocado prices, [Online], Available : https://www.kaggle.com/neuromusic/avocado-prices, 2018.
- R. Shams, Creating training, validation and test sets (data preprocessing), [Online], Available : https://www.youtube.com/watch?v=uiDFa7iY9yo, 2014.
- P. Thongpool, P. Jamrueng, R. Boonrit, S. Sinsomboonthong, “Performance comparison in prediction of imbalanced data in data mining classification,” Thai Journal of Science and Technology, 8(6), 565-584, 2019.
- S. Sinsomboonthong, “An efficiency comparison in prediction of imbalanced data classification with data mining techniques,” Thai Journal of Science and Technology, 8(3), 383-393, 2019.
- N. Phonchan, P. Jaimeetham, S. Sinsomboonthong, “Clustering efficiency comparison of outliers data in data mining,” Thai Journal of Science and Technology, 9(5), 589-602, 2020.
- S. Sinsomboonthong, “An efficiency comparison in prediction of outlier six classifications,” Thai Journal of Science and Technology, 9(3), 255-268, 2020.
- T. Jayalakshmi, A. Santhakumaran, “Statistical normalization and back propagation for classification,” International Journal of Computer Theory and Engineering, 3(1), 89-93, 2011.
- J. Han, M. Kamber, Data mining concepts and techniques, 2nd ed, Morgan Kaufmann, 2006.
- O.G. Troyanskaya, M. Cantor, G. Sherlock, O. Patrick, P.O. Brown, “Missing value estimation methods for DNA microarrays,” Bioinformatics, 17(6), 520-525, 2011.
- R. Thammasombat, Decision support system for mobile internet package selection using decision tree, Ph. D Thesis, Business Computer, Faculty of Business Administration, Ratchapruek College, 2012.
- K. Waiyamai, C. Songsiri, T. Rakthammanon, “Using data mining techniques to improve the quality of education for students of the faculty of engineering,” The NECTEC Technical Journal, 11(3), 134-142, 2011.
- D.T. Larose, Discovering knowledge in data : an introduction to data mining, John Wiley & Sons, 2005.
- D.T. Larose, Data mining methods and models, John Wiley & Sons, 2005.
- K. Wanichbancha, Multivariate data analysis, Thammasarn Co Ltd, 2009.
- S. Sripaaraya, S. Sinsomboonthong, “Efficiency comparison of classifications for chronic kidney disease : a case study hospital in India,” Journal of Science and Technology, 25(5), 839-853, 2017.