Explainable AI and Active Learning for Photovoltaic System Fault Detection: A Bibliometric Study and Future Directions
 , René Yamapi 5, Moskolai Ngossaha Justin 3, Bowong Tsakou Samuel 3, Bernard Kamsu Fogue 6
Adv. Sci. Technol. Eng. Syst. J. 10(3), 29–44 (2025);
 DOI: 10.25046/aj100305
Persistent anomalies in modern photovoltaic (PV) systems present a formidable challenge, impeding optimal power output and system resilience. Artificial Intelligence (AI) has surfaced as a game-changing solution, yet existing research has merely scratched the surface of solar panel prognosis, leaving a critical void in leveraging AI’s explainable nature and active learning capabilities. This pioneering study investigates AI methods for detecting and classifying critical faults in PV systems, pushing the boundaries of innovative methodologies for fault identification. We acknowledge that the opacity of AI methods can hinder their adoption, particularly among practitioners, thus emphasizing Explainable AI (XAI) in an exhaustive bibliometric analysis. This study showcases authors who thoroughly detail their development processes and underscores the indispensable role of human/expert interaction in active learning for labeling the most informative data. Our findings unveil a glaring underutilization of XAI in the solar panel domain, with China at the forefront of this field. This leadership is likely attributed to the robust research focus in Chinese universities and China’s position as the world’s leading solar panel producer. We delve into the potential role of human/expert involvement in designing and deploying deep learning predictive applications, highlighting methods that harmoniously integrate practical knowledge from human end-users through active learning. Our methodology encompasses extensive data collection, bibliometric analysis of collaborations between entities, researchers, and nations, and an examination of the most prevalent persistent faults. We conclude by strongly advocating for future studies to address the underutilization of XAI and active learning in AI-based defect prediction. Bridging this gap is crucial for pinpointing the root causes of solar panel defects and enhancing prognosis, positioning this research as indispensable for both scientists and industry professionals at the forefront of PV technology.
1. Introduction
1.1. Photovoltaic System
Photovoltaic energy is derived from the direct conversion of sunlight into electricity through solar cells, also known as photovoltaic cells, which form the basic component of a photovoltaic production chain. The assembly of multiple photovoltaic cells forms a photovoltaic module, commonly referred to as a solar panel [1]. A photovoltaic power plant is a solar installation comprised of numerous interconnected modules to generate electricity on a large scale, often intended to supply an electrical grid [2].
Over the past few decades, photovoltaic electricity production has experienced extremely significant growth worldwide. The International Energy Agency’s forecasts for the year 2025 indicate that solar energy will provide approximately 60% of the total demand for renewable energy, placing it at the forefront of the most promising sources [3]. In terms of production, China positions itself as the world’s leading producer of solar panels and has strongly committed to increasing its share of non-fossil fuel energy usage to 25% by 2030, aiming to satisfy 27.5% of the world’s energy demand with solar energy by 2050 [4]. It is worth noting, however, that African nations are not lagging behind in this crucial fight against global warming and the adoption of green energies. For instance, Ghana has embarked on a major transition towards renewable energy. The Ghanaian government has adopted a master plan aimed at increasing electricity production capacity from 42.5 MW in 2015 to 1363.63 MW by 2030, with photovoltaic solar sources representing more than 50% of the total capacity [5]. Solar highways also offer enormous opportunities for Bangladesh [6]. However, the use of photovoltaic (PV) modules for energy production is not a simple task, due to potential degradation that can lead to a decrease in the performance and efficiency of PV solar installations [7]. According to recent studies, the degradation rate varies between 0.6% and 0.7% per year [8]. Therefore, it is imperative to examine the defects that may compromise the proper functioning of photovoltaic solar installations.
1.2. Fault Detection
Solar panel defects refer to any abnormalities or problems affecting the structure, performance, or durability of photovoltaic solar panels. These imperfections may encompass manufacturing, transportation, installation, environmental, or electrical defects that can cause a decrease in energy efficiency, a reduction in useful lifespan, or safety risks. Failures in PV systems result from various factors such as shading, module contamination, inverter failure, and variations in manufacturing or aging of photovoltaic modules, among others [9-10]. These elements can lead to a performance decrease of over 2.5%, progressively contributing to the deterioration of the affected component’s longevity [10].
Generally, these defects can be classified into three main categories: abrupt, intermittent, and incipient faults. Ground-fault or line-to-line short circuits, open-circuit defects, connector disconnections, and junction box anomalies are examples of abrupt faults that occur when part or all of the PV network is damaged. Partial shading or environmental fluctuations represent examples of temporary or intermittent fault sources that may fade or evolve over time (such as dust or contamination). The third type, called incipient faults, manifests as minor but potentially dangerous anomalies that evolve slowly over time, making their initial detection difficult. If not identified timely, their consequences can be hard to control. These faults can occur on both the DC side, i.e., PV module and DC-DC converter parts (such as yellowing and browning of solar cells, delamination, cracks, bubbles, and anti-reflective coating defects), as well as on the AC side, i.e., the inverter side (examples include bipolar transistor faults, overheating, aging, and degradation of connection cabling) [11-12].
In the literature, several approaches to detecting and diagnosing faults in solar systems are distinguished. These methods are primarily characterized by their ability to quickly detect malfunctions, to instantly analyze the necessary input data (whether climatic or electrical), and to be selective, i.e., able to distinguish the type of fault in question. Thus, they can be classified into two main families: Visual and thermal methods specific to detecting malfunctions such as discoloration, browning, soiling, hotspots, breakage, delamination, etc., and Electrical methods that focus on defective PV modules, strings, and matrices, including arc, ground, and diode faults, etc. [13-15]. However, it often happens that both approaches are combined to solve specific malfunctions, as is the case with Artificial Intelligence methods.
1.3. Contributions and Research Objectives of the Paper
Bibliometric research is a quantitative analysis method used to study scientific publications. It aims to measure and evaluate different aspects of scientific production, such as the number of publications, citations, journal impact, and collaboration networks between researchers and institutions. Bibliometrics also quantifies researchers’ contributions, identifies research trends, tracks field evolution, and assesses research impact on the scientific community. It is widely employed in scientific policy decision-making, resource allocation, and researcher and institution performance evaluation. In recent years, numerous researchers and fields have shown interest in bibliometrics. References [16-18] respectively present the use of bibliometric techniques to examine basic research on blockchain technology in the energy sector, the state of research on using blockchain technology for environmental sustainability in the building sector, and recent progress in electrolyzer control technologies for hydrogen production. Other works like reference [19] analyze research trends in big data analysis of the Internet of Things (IOT) and fog computing in the health sector, and reference [20] performs a comprehensive analysis of research in Energy System Analysis (ESA) using statistical techniques. Reference [21] provides a detailed analysis of research on predictive maintenance 4.0 by artificial intelligence, while references [22-23] focus on emerging techniques and trends in equipment maintenance systems, and reference [24] presents the evolution of artificial intelligence. Reference [25] offers a literature review on machine learning in industrial applications.
In the field of solar energy, bibliometric analysis has been integrated to identify emerging research areas and provide an impartial overview of current research status. A key work to date is that of [26], where bibliometrics was used to analyze a large number of documents on artificial intelligence methods for detecting and diagnosing faults in photovoltaic systems published since 2023.
To our knowledge, no bibliometric study on the prognosis by artificial intelligence of critical anomalies for predictive maintenance of photovoltaic systems has been identified. This gap in the literature pertains to the targeted faults, which can lead to total or partial shutdown of electricity production in photovoltaic systems, remaining unexplored.
In this research, we undertake a bibliometric analysis of publications indexed in the Scopus database, focusing specifically on the prognosis of critical faults in photovoltaic systems through artificial intelligence methods. We pay particular attention not only to the explanatory and descriptive aspect of the design and application procedures of AI methods but also to highlighting studies on human involvement in the AI integration process. In photovoltaic engineering, fault diagnosis identifies and locates current anomalies through real-time or historical data analysis and inspection techniques, aiming for quick detection for immediate corrective measures. Prognosis predicts the evolution and severity of future problems using degradation models and historical data, enabling planning of preventive maintenance actions to extend solar system life and minimize production interruptions.
Several questions arise in this work, including: What are the current trends in AI involvement in diagnosing and prognosing faults in PV systems? What is the role of active learning (human/expert involvement) in machine learning implementation for this problem? What are the main challenges related to AI methods application in PV system lifespan prognosis?
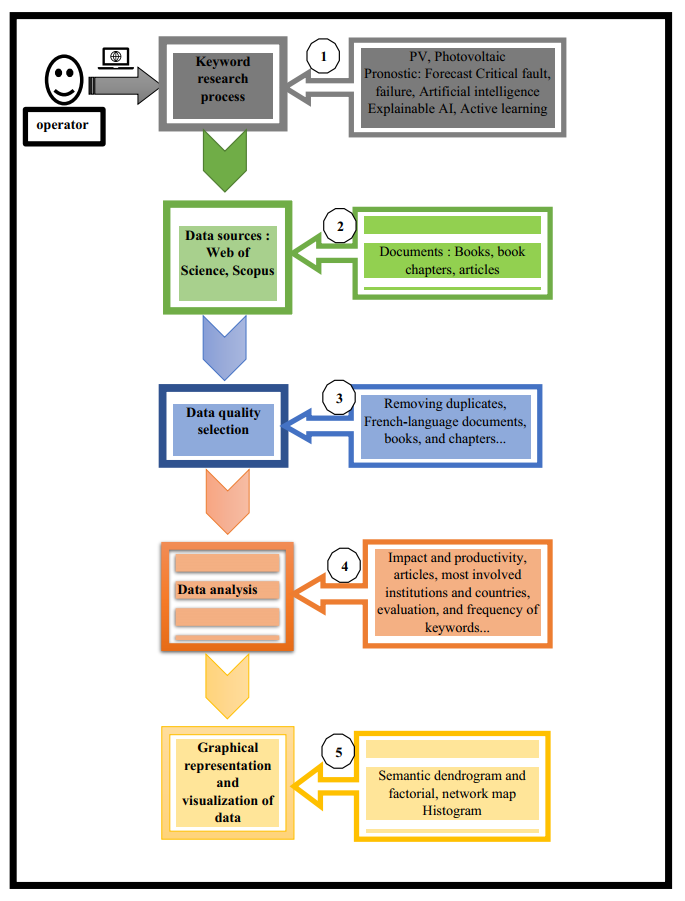
Figure 1 presents the flowchart of actions for this work: (1) and (2): Data collection from the Scopus database using specific keywords related to the topic. (3): Selection of important documents based on quality criteria, aiming to create a database containing necessary and relevant information to determine hidden relationships automatically. (4) and (5): Processing, analysis, and visualization of selected documents using tools such as R Bibliometrix (Biblioshiny) [27] or VOSviewer [28]. Highlighted information includes main trends, collaboration networks, most cited documents, challenges in AI prognosis of defects, XAI trends, human involvement in AI implementation, publication trends over time, most productive authors, leading countries, and frequent keywords.
1.4. Explainable IA Learning and Active Learning
1.4.1. Explainable IA
Machine learning methods, particularly with the advent of neural networks (NN), are now widely used in engineering applications. This success has led to considerable adoption of machine learning (ML) in many scientific fields, including photovoltaic energy. However, most modern AI techniques suffer from the concept of the black box nature, which hinders their adoption by practitioners in many application areas. Explainability is a prerequisite to ensure the scientific value of the result. In this context, research directions such as explainable artificial intelligence (AI) [29], informed machine learning [30], or intelligible intelligence [31] have emerged.
The term XAI, for “eXplainable Artificial Intelligence,” refers to a set of processes and methods aimed at making every result calculated by artificial intelligence understandable. It is a field of Machine Learning that seeks to precisely justify a given result by a model. Explainable AI (or XAI) is thus a research area in artificial intelligence that aims to create AI systems capable of explaining their decisions, actions, or results in a way that is understandable to humans. This approach distinguishes itself from many current AI systems, particularly those based on deep learning, which are often considered “black boxes” due to the difficulty in understanding their internal functioning [32-33].
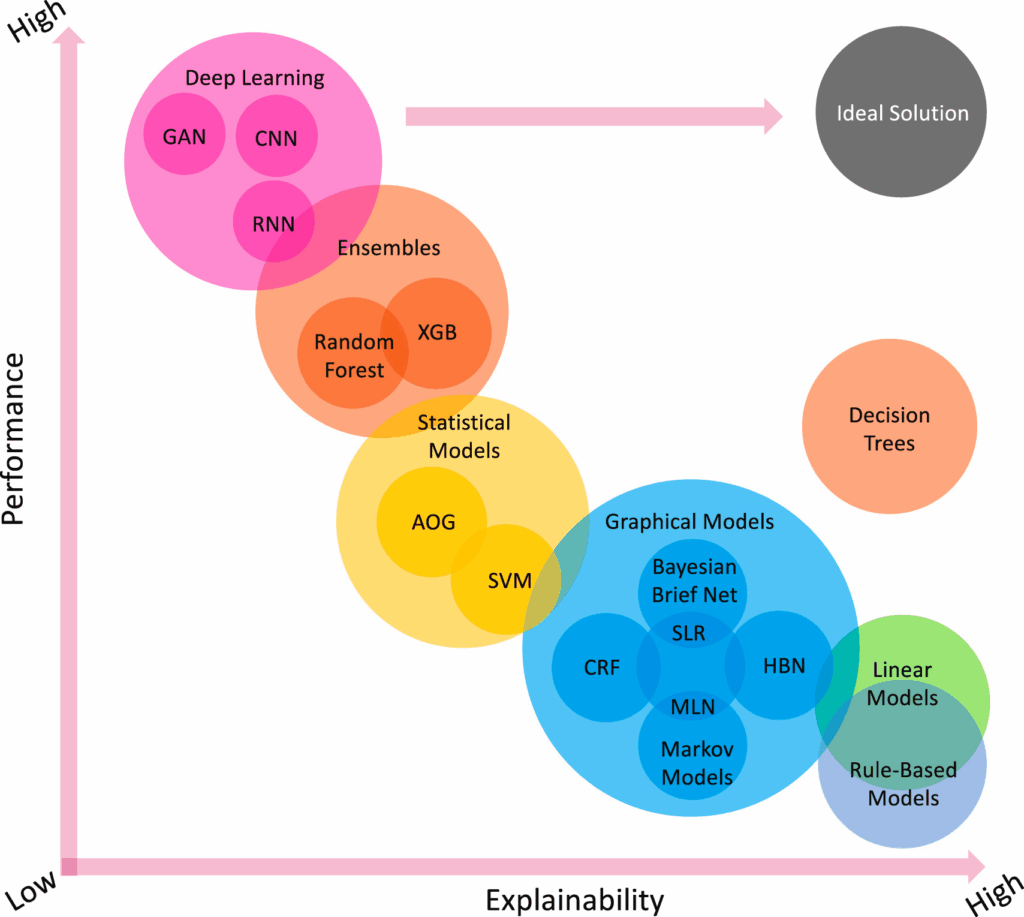
Figure 2 above highlights the contrast between precision and explainability of the most commonly used models. Special attention is given to Artificial Neural Networks (ANNs), which constitute the majority of the most used AI methods in PV fault detection and prognosis. From this graph, it is clear that ANNs are very precise but have low explainability. The explainability of AI in general, or machine learning in particular, helps to answer questions such as: why did you make this decision? Why didn’t you act differently? When will you succeed or fail? How do you correct the error? These questions should be addressed in the development and implementation of different AI methods.
To be more precise, terms and indicators that highlight this concept may include: AI interpretability, model transparency, explainability of algorithms, post-hoc analysis of decisions, methods for visualizing decision-making processes, detailed documentation of AI models, interpretation of AI results, identification of explanatory factors in AI predictions, etc.
1.4.2. Active Learning
Nowadays, discussing deep learning and artificial intelligence without addressing image analysis and interpretation, as well as their use for extracting essential information for purposes such as computer-aided detection, prognosis, treatment planning, intervention, and preventive maintenance of systems, is essential. However, the unique challenges posed by data analysis, particularly in the context of detecting and predicting defects in photovoltaic systems, suggest that it would be beneficial to maintain the presence of a human end-user in any system using deep learning, specifically, or artificial intelligence, in general [35].
Active learning is an approach to artificial intelligence that involves humans in the learning process to improve the efficiency and accuracy of the AI algorithm. In this approach, the algorithm selects the most informative data for which it needs labels, rather than relying on randomly labeled data [36]. Human involvement in the active learning process can take different forms, such as providing labels for data selected by the algorithm, correcting errors made by the algorithm, or providing feedback on the results of the algorithm. Active learning has many advantages over traditional machine learning, such as reducing the amount of labeled data required to train the AI algorithm and improving the accuracy of the AI algorithm [37-38].
Specifically, some terms and indicators that may highlight this method are: Interactive learning, Active data selection, Human feedback in the learning process, User query systems, Data labeling optimization, Data acquisition methods, Iterative improvement of the model through human interaction, Dynamic adaptation of the learning process to user needs.
2. Research Methodology
2.1. Bibliometric Analysis
Conducting a rigorous bibliometric analysis requires a structured approach. It begins with the clear formulation of research questions and the selection of suitable bibliometric methods. Data collection is then performed using reputable sources such as Web of Science, Scopus (as in this study), Google Scholar, or ScienceDirect, ensuring the reliability of the information. Once collected, the data is analyzed using advanced statistical techniques to uncover trends and correlations. The results are then carefully interpreted and visualized through specialized tools, enabling a comprehensive understanding of the research dynamics.
2.2. Data Collection from Scopus
For this study, we used Scopus as the primary source of bibliographic data [39-40]. This platform offers a wide range of scientific publications in various fields. Data were collected using relevant keywords for our research topic. We then applied data exploration techniques to identify the most relevant publications. The collected data includes information such as article titles, authors, affiliations, keywords, abstracts, and citation counts. Table 1 provides a recapitulation of the information gathered after the search.
2.3. Scanning and Keywords Search
To ensure robust and relevant conclusions, we developed a rigorous data collection methodology. On April 23, 2024, we began by exploring Scopus, a leading bibliometric database. Our search strategy was built around carefully selected keywords relevant to the field: “PV,” “Photovoltaic,” “Fault,” “Failure,” “Anomaly,” “Detection,” “Diagnosis,” “Prognosis,” “Classification,” “Artificial Intelligence,” “Machine Learning,” “AI explainable,” “XAI,” “Active learning,” and “Feedback experiment.” These terms guided the identification of documents likely to inform our understanding of current issues and technological advances. Next, we applied strict selection criteria: only English-language documents published in internationally recognized journals and conferences were retained. This ensured the inclusion of high-quality, relevant materials.
The process yielded a curated corpus of 225 documents. Despite their volume, we noted a relative scarcity of studies addressing explainable AI and active learning in photovoltaic fault prediction. Nonetheless, the selected literature provides a solid foundation for analyzing trends and innovations in this area.
Overall, this rigorous and selective approach enhances the credibility of our findings and contributes meaningfully to academic discourse on contemporary energy challenges [41]
3. Analysis and Results
In bibliometric analysis, it is important to discuss the two main approaches for creating bibliometric maps: distance-based methods, such as multidimensional scaling [42], visualization of similarities (VOS) [43], force-directed placement [44-45], among others, and graph-based methods [46].
In the photovoltaic research field, a distance-based bibliometric mapping was performed using VOSviewer [47] and R-bibliometrix. This approach enables the visualization of relationships between different entities such as authors, laboratories, and countries, and measures their strength [48-49]. Using association strength as a similarity metric, co-occurrence maps of keywords were created to identify research subdomains in the photovoltaic field.
3.1. Main Information About the Collection
Table 1 provides an overview of the 225 publications collected from the Scopus search engine based on the selection criteria. It contains a total of 776 keywords and over 900 authors, with a detailed distribution between unique and multiple authors.
Table 1: Main Information about the Data Comprehensive Analysis Over 20 Years: 173 Sources, 225 Documents, highlighting 12.37% Annual Growth, Emphasizing Explainable AI and Active Learning for PV Fault Detection.
| MAIN INFORMATION ABOUT DATA | |
| Timespan | 2002:2024 |
| Sources (Journals, Books, etc) | 173 |
| Documents | 225 |
| Annual Growth Rate % | 12,37 |
| Document Average Age | 4,37 |
| Average citations per doc | 58,97 |
| References | 0 |
| DOCUMENT CONTENTS | |
| Keywords Plus (ID) | 2002 |
| Author’s Keywords (DE) | 776 |
| AUTHORS | |
| Authors | 927 |
| Authors of single-authored docs | 36 |
| AUTHORS COLLABORATION | |
| Single-authored docs | 41 |
| Co-Authors per Doc | 4,58 |
| International co-authorships % | 0 |
| DOCUMENT TYPES | |
| article | 89 |
| Book | 43 |
| book book | 1 |
| book chapter | 10 |
| conference paper | 17 |
| editorial | 1 |
| review | 63 |
| review book | 1 |
Table 1 provides an overview of the main information from the research conducted over a period of more than 20 years, from 2002 to 2024. The research was based on 173 sources and analyzed 225 documents, indicating its comprehensive nature. The annual growth rate of 12.37% suggests evolving research in this field, particularly in the areas of explainable AI and active learning for PV fault detection. With an average of 58.97 citations per document, the work is increasingly recognized and utilized within the scientific community, bolstering its credibility. Involving 927 authors and encompassing various document types, including articles, books, book chapters, conference proceedings, editorials, and reviews, the research was conducted exhaustively to provide a comprehensive analysis of the subject. The significant number of authors highlights the importance of collaborative ideas in this field.
3.1.1. Annual Scientific Publication Trend
This section examines the annual trend of scientific publications in the field of interest. Analysis was conducted on the number of documents published each year between 2002 and 2024 using the Scopus database. Table 2 presents bibliometric data for articles published during this period, including measures such as the average number of citations per article (MeanTCperArt), the total number of articles (N), the average number of citations per year (MeanTCperYear), and the number of citable years (CitableYears).
Table 2: Annual Scientific Publication Trend: Average citations per article in solar panel defect research vary widely annually, ranging from 0.08 in 2024 to 395 in 2010, indicating evolving trends in explainable AI.
| Year | MeanTCperArt | N | MeanTCperYear | CitableYears |
| 2002 | 22 | 1,00 | 0,96 | 23 |
| 2003 | 50 | 1,00 | 2,27 | 22 |
| 2004 | 38 | 1,00 | 1,81 | 21 |
| 2006 | 21 | 1,00 | 1,11 | 19 |
| 2007 | 135,5 | 2,00 | 7,53 | 18 |
| 2009 | 88,5 | 2,00 | 5,53 | 16 |
| 2010 | 395 | 4,00 | 26,33 | 15 |
| 2011 | 8,5 | 2,00 | 0,61 | 14 |
| 2012 | 270,17 | 6,00 | 20,78 | 13 |
| 2013 | 69 | 2,00 | 5,75 | 12 |
| 2014 | 90,33 | 3,00 | 8,21 | 11 |
| 2015 | 413,56 | 9,00 | 41,36 | 10 |
| 2016 | 63,75 | 4,00 | 7,08 | 9 |
| 2017 | 89,14 | 14,00 | 11,14 | 8 |
| 2018 | 56,44 | 9,00 | 8,06 | 7 |
| 2019 | 57,23 | 13,00 | 9,54 | 6 |
| 2020 | 42,38 | 26,00 | 8,48 | 5 |
| 2021 | 24,58 | 24,00 | 6,14 | 4 |
| 2022 | 16 | 39,00 | 5,33 | 3 |
| 2023 | 5,47 | 49,00 | 2,73 | 2 |
| 2024 | 0,08 | 13,00 | 0,08 | 1 |
It can be observed that the average number of citations per article (MeanTCperArt) varies significantly from year to year, with values ranging from 0.08 in 2024 to 395 in 2010. The total number of articles (N) has also increased over the years, from 1 in 2002 to 49 in 2023; this low value of MeanTCperArt in 2024 may be due to the fact that explainable AI is still under development in the field of prognosis and diagnosis of defects in solar panels. As indicated in the article by [50], there are still significant challenges to be addressed to make AI models more transparent and understandable to end-users.
The average number of citations per year (MeanTCperYear) has also varied over the years, with values ranging from 0.08 in 2024 to 41.36 in 2015. Regarding this downward trend in recent years, this may be partly due to the time it takes for articles to be read, cited, and integrated into the literature. As noted by Pan 2019 [49], there can be a lag of several years between the publication of an article and its actual impact on the field.
Finally, the decrease in the number of citable years (CitableYears) may be related to the rapid evolution of technology and methods used in the field of prognosis and diagnosis of defects in solar panels. Utama and colleagues highlighted this in their work in [50], where they explain that as more new AI methods are constantly being developed and implemented, this could make previous work obsolete more quickly.
3.1.2. Most Productive, Impact and Source Growth Dynamics
The data presented in Table 3 below show the most productive, impactful, and source journals in the field of solar energy, based on different bibliometric indicators such as the h-index, g-index, m-index, total number of citations (TC), number of publications (NP), and year of first publication (PY_start).
Table 3: Most Productive, Impact, and Source Growth Dynamics
| Element | h_
index |
g_
index |
m_
index |
TC | NP | PY_
start |
| Energies | 7 | 13 | 1 | 187 | 16 | 2018 |
| Renewable and Sustainable Energy Reviews | 6 | 6 | 0,667 | 635 | 6 | 2016 |
| IEEE Access | 4 | 7 | 0,8 | 91 | 7 | 2020 |
| Solar Energy | 4 | 5 | 0,5 | 419 | 5 | 2017 |
| Chemical Reviews | 3 | 3 | 0,3 | 3493 | 3 | 2015 |
| IEEE Transactions on Power Electronics | 3
|
3 | 0,375 | 201 | 3 | 2017 |
| Sustainability (Switzerland) | 3 | 3 | 0,75 | 34 | 3 | 2021 |
| Applied Energy | 2 | 2 | 0,667 | 36 | 2 | 2022 |
| Electronics (Switzerland) | 2 | 3 | 0,333 | 24 | 3 | 2019 |
| IEEE Power And Energy Society General Meeting | 2 | 2 | 0,182 | 6 | 2 | 2014 |
| International Journal of Heat and Mass Transfer | 2 | 2 | 0,087 | 72 | 2 | 2002 |
| International Journal of Hydrogen Energy | 2 | 2 | 0,182 | 322 | 2 | 2014 |
| International Transactions on Electrical Energy Systems | 2 | 2 | 0,5 | 53 | 2 | 2021 |
It’s apparent that the journal “ENERGIES” boasts the highest h-index (7), indicating it has published at least 7 articles each cited 7 times or more. However, “RENEWABLE AND SUSTAINABLE ENERGY REVIEWS” leads in total citations, with its articles garnering 635 out of 1759 total citations (36.1%). Mo Moreover, this journal has published the highest number of articles (6) since 2016, showcasing its influence. “IEEE ACCESS,” although relatively recent, starting in 2020, has an h-index of 4 and 91 citations, representing 5.2% of the total, placing it third in impact and productivity. “SOLAR ENERGY” shares an h-index of 4 but boasts a higher total citation percentage of 23.8% (419 out of 1759), despite having fewer publications (5) since 2017. This indicates its articles have a significant impact in the solar energy field. Notably, some journals exhibit a high m-index, indicating uniform citations across their articles, like “CHEMICAL REVIEWS,” with an m-index of 0.3. Additionally, newer journals such as “SUSTAINABILITY (SWITZERLAND)” and “APPLIED ENERGY” have also made an impact, starting in 2021 and 2022, respectively. “INTERNATIONAL JOURNAL OF HYDROGEN ENERGY” received 322 citations, representing 18.3% of total citations, making it a vital source in solar energy research, particularly regarding hydrogen energy.
This information aids in focusing on influential journals in solar energy and AI, guiding research toward high-quality, consistently cited articles. It underscores the growing interest in explainable AI and active learning in PV fault prognosis, despite their current underrepresentation. The involvement of prestigious journals like “ENERGY,” “RENEWABLE AND SUSTAINABLE ENERGY REVIEWS,” and “IEEE ACCESS” signals the necessity for further research in these areas. This suggests a potential pathway for enhancing solar panel defect detection using explainable AI and active learning, ultimately improving the reliability and performance of solar energy systems.
3.1.3. Most Globally Cited Papers and References
Table 4 presents an overview of the 20 most cited documents published in the Scopus database during the study period, with accompanying graphical representation in Figure 3. The columns include Total Citations, TC per Year, and Normalized TC, accounting for publication year and field.
Table 4: Most Globally Cited Papers
| Paper | Total Citations | TC per Year | Normalized TC | |
| [51] | 2285 | 228,50 | 5,53 | |
| [52] | 1256 | 96,62 | 4,65 | |
| [53] | 1173 | 78,20 | 2,97 | |
| [54] | 1096 | 109,60 | 2,65 | |
| [55] | 421 | 52,63 | 4,72 | |
| [56] | 291 | 48,50 | 5,08 | |
| [57] | 255 | 17,00 | 0,65 | |
| [58] | 232 | 29,00 | 2,60 | |
| [59] | 231 | 46,20 | 5,45 | |
| [60] | 224 | 17,23 | 0,83 | |
| [61] | 206 | 18,73 | 2,28 | |
| [62] | 190 | 23,75 | 2,13 | |
| [63] | 189 | 27,00 | 2,98 | |
| [64] | 187 | 23,38 | 2,10 | |
| [65] | 157 | 8,72 | 1,16 | |
| [66] | 152 | 21,71 | 2,39 | |
| [67] | 152 | 9,50 | 1,72 | |
| [68] | 150 | 2,35 | 2,35 | |
| [69] | 147 | 29,40 | 3,47 | |
| [70] | 138 | 69,00 | 25,23 |
From the table data, it can be seen that the most cited article is “LU L, 2015, Chem. Rev.” with a total of 2285 citations, which also represents the highest number of citations per year (228.50) and normalized citations (5.53). This article has therefore had a significantly important impact in the studied research field. Other articles also have high citation numbers, such as “JØRGENSEN M, 2012, Adv. Mater.” with 1256 citations and “TODESCHINI R, 2010, Mol. DESCRIPTORS CHEMOINFORMATICS” with 1173 citations. However, some articles have lower citation numbers, such as “SABNIS RW, 2010, Handb. Biol. Dye. Stain. Synth. Ind. Appl.” with 255 citations and “MANNAN S, 2012, LEES’ LOSS Prev. Process. Ind. Hazard Identif. Assess. Control. Fourth Ed.” with 224 citations.
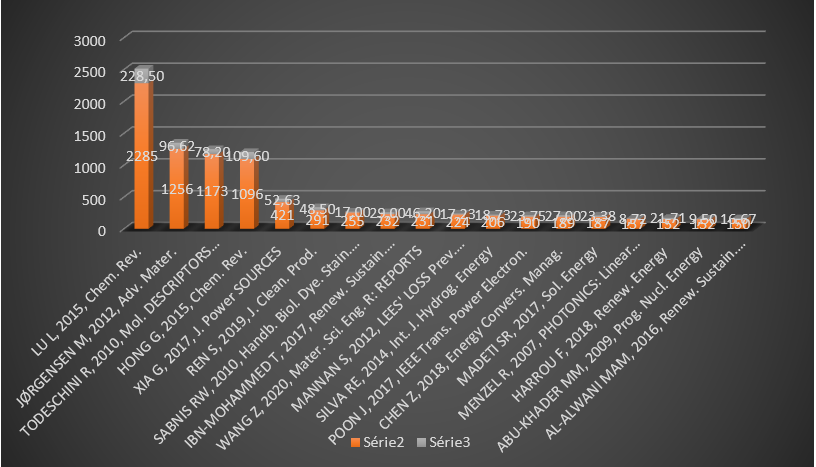
By examining the normalized citation data, it can be seen that some articles have high numbers, such as “REN S, 2019, J. Clean. Prod.” with 5.08 and “WANG Z, 2020, Mater. Sci. Eng. R: REPORTS” with 5.45, indicating that these articles have had a significant impact in their respective research fields, despite their lower total number of citations.
Figure 3 highlights the articles that have attracted the most attention in the domains of explainable AI and active learning. While some do not explicitly mention these fields, they contribute significantly by applying AI and machine learning to related areas such as solar technology, chemistry, materials science, and renewable energy. As noted in [71], explainable AI and active learning are rapidly growing research areas, marked by a steady rise in publications and citations across disciplines.
However, it is important to note that most of these articles focus on the use of AI and machine learning to improve the performance and efficiency of PV solar systems, rather than on the explainability and transparency of the models themselves. This highlights the need for more in-depth research in the field of explainable AI and active learning to develop more interpretable models and build trust in AI systems.
Furthermore, it should be noted that this analysis is based solely on data from the Scopus database, which may limit the generalizability of the results. Future studies could consider including other databases for a more comprehensive analysis of the literature on explainable AI and active learning applied to PV fault prognosis.
3.1.4. Most Productive and Highly Cited Authors
Table 5 shows the number of articles published by the most productive authors in the studied field, as well as their fractionalized number of articles and their number of citations.
Table 5: Most Productive and Highly Cited Authors: The table highlights the most productive and highly cited authors in the field, emphasizing their significant contributions to the research on solar panel fault diagnosis and prognosis, particularly through the use of AI methods.
| Authors | Articles | Articles Fractionalized |
| SUN Y | 5 | 1,15 |
| ZHANG Y | 5 | 1,03 |
| HARROU F | 4 | 0,90 |
| LIU Z | 4 | 0,46 |
| TAGHEZOUIT B | 4 | 0,90 |
| WANG C | 4 | 0,10 |
| WANG H | 4 | 0,41 |
| WANG Z | 4 | 0,69 |
| YU H | 4 | 0,10 |
| BANSAL RC | 3 | 1,37 |
| BLAABJERG F | 3 | 0,73 |
| LIU C | 3 | 0,29 |
| LIU J | 3 | 0,45 |
The table shows that SUN Y is the most productive author in this research field, with 5 published articles. However, when considering fractionalized articles—which account for each author’s specific contribution to a publication—SUN Y attains a higher score (1.15) than other authors with the same number of publications. This indicates that SUN Y’s contributions are relatively more substantial. Authors HARROU F, LIU Z, TAGHEZOUIT B, and WANG Z each published 4 articles, yet their fractionalized scores vary between 0.46 and 0.90, reflecting differences in their levels of involvement. Notably, BANSAL RC, despite having only 3 publications, holds the highest fractionalized article score of 1.37 among all authors, emphasizing the significant impact of his contributions to the field.
The relatively low number of articles and authors may be attributed to a lack of explicit focus on the explainability of artificial intelligence in the development process of AI methods for PV fault diagnosis and prognosis.
Regarding co-authorship, Table 6 presents data concerning the collaboration network between authors, where each line represents a node in this network. The “Cluster” field indicates that all nodes belong to the same cluster (Cluster 1).
Table 6: Most Cited Authors
| Node | Cluster | Betweenness | Closeness | PageRank | |
| zhang y | 1 | 0 | 0,017857143 | 0,007070492 | |
| liu z | 1 | 33 | 0,027777778 | 0,028781946 | |
| wang c | 1 | 6,116666667 | 0,03125 | 0,036368497 | |
| wang h | 1 | 6,116666667 | 0,03125 | 0,036368497 | |
| wang z | 1 | 0 | 0,019230769 | 0,006478859 | |
| yu h | 1 | 6,116666667 | 0,03125 | 0,036368497 | |
| blaabjerg f | 1 | 0 | 0,017241379 | 0,005235847 | |
| liu c | 1 | 42 | 0,026315789 | 0,026182215 | |
| liu p | 1 | 21,78333333 | 0,032258065 | 0,039046276 | |
| liu y | 1 | 30,5 | 0,027027027 | 0,02590086 |
The table presents the centrality measures of 10 nodes in a network, grouped into a single cluster. The centrality measures include betweenness centrality, closeness centrality, and PageRank. It can be observed that the node “liu z” has the highest betweenness centrality value (33), indicating that it is most often on the shortest paths between other nodes in the network. The nodes “wang c”, “wang h”, “yu h”, and “blaabjerg f” all have low betweenness centrality values (less than 7), suggesting that they are less frequently on the shortest paths between other nodes. In terms of closeness centrality, the nodes “wang c”, “wang h”, and “yu h” have the highest value (0.03125), which means that they are closest to all other nodes in the network. Finally, the node “liu p” has the highest PageRank value (0.039046276), indicating that it is the most important in terms of incoming and outgoing connections with other important nodes in the network.
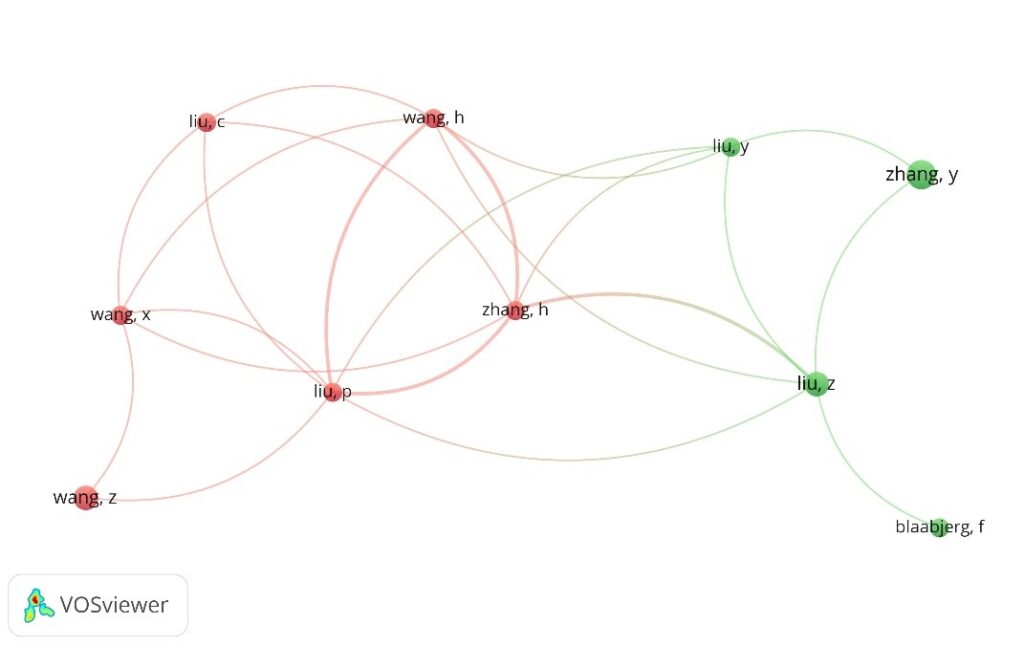
Indeed, one can observe a limited number of active authors and less collaboration in the studied field, as depicted in the figure, which could be explained by several factors. Firstly, the domain’s specificity and the specialized technical skills required to integrate approaches such as explainable AI and active learning may restrict the number of active authors. Secondly, the complexity of these methods and the communication challenges between researchers from different fields may diminish collaboration opportunities. Finally, in a developing field, competition to publish the first significant results may also hinder collaboration among researchers.
3.2. Citation Analysis
3.2.1. Co-Occurrence
The aim of this co-occurrence analysis is to illuminate potential relationships between two elements present in bibliographic works that appear together [72-73]. Utilizing certain standardized and automated methodologies [74-75], data can be extracted and visually represented using tools such as VOSviewer, R Bibliometrix, as demonstrated in this study for widespread application in conducting co-occurrence analyses of keywords across various areas of expertise.
a. Co-occurrence of all keywords.
Table 7: Most Cited Keywords
| Words | Occurrences |
| fault detection | 32 |
| solar power generation | 30 |
| solar energy | 22 |
| photovoltaic cells | 14 |
| photovoltaics | 13 |
| electric inverters | 12 |
| photovoltaic systems | 12 |
| failure analysis | 11 |
| solar panels | 11 |
| deep learning | 10 |
| power quality | 10 |
| wind power | 10 |
| fault tolerance | 9 |
| learning systems | 9 |
Table 7 presents the main keywords along with their frequency of occurrence. It is evident that specific learning techniques are currently utilized as scientific methodologies, producing favorable results in defect detection within photovoltaic systems. However, the explainability of AI is notably underrepresented, as reflected by its absence among the most frequently cited keywords. To deepen understanding of key terms, their clusters, associations, and temporal relevance, two bibliometric maps were generated. For clarity and focus, only keywords appearing at least five times were included in these maps.
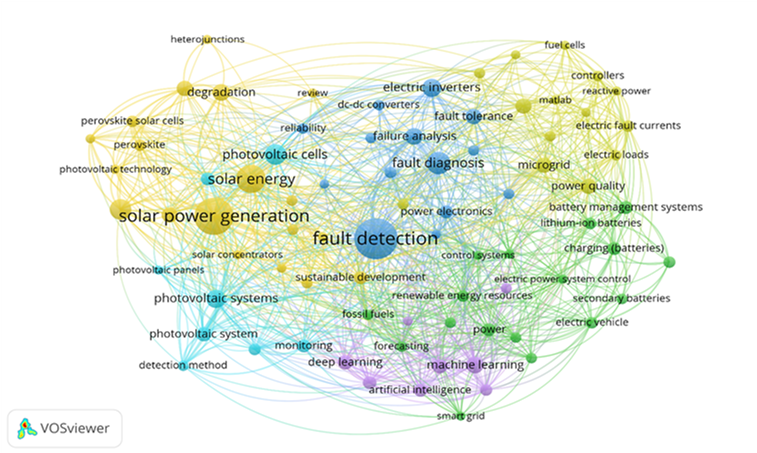
The first map presents six keyword clusters, reflecting associations among the articles. Keyword co-occurrence—indicating simultaneous appearance—is shaped by proximity and similarity. Figure 5 visualizes these clusters, highlighting groups of keywords that frequently appear together and are organized by associated methods. Table 8 provides a summary of these co-occurring keyword clusters.
Table 8: Clusters of Co-occurring Keywords showcase thematic groupings
| N cluster | Node |
|
Cluster1 |
Carbon, degradation, heterojunction, life cycle, perovskite, perovskite solar cells, photovoltaic modules, photovoltaic technology, photovoltaics, reneweble energies, renewable energy, renew, solar celles, solar concentrators, solar energy, solar panels, solar power generation, sustainable developmer |
| Cluster2 | Batteremy management system, charging (batteries), control systems, diital storage, electric power system control, electric power transmission, electric vehicle, electric vehicles, energy storage, forecasting, fossils fuels, lithium-ion batteries, optimization, power, reneweble energy resource, secondary batteries, smart grid. |
|
Cluster3 |
dc-dc converters, electric drives, electric inverters, failure analysis, fault detection, fault diagnosis, fault tolerance, faults diagnosis, neural networks, power converters, power electronics, reability, timing circuits, topology. |
|
Cluster4 |
Controllers, electric fault currents, electric loads, energy conversion, fault, fuel cells, MATLAB, microgrid, microgrids, performance, power quality, reactive power, sliding mode control, wind power. |
|
Cluster5 |
Artificial intelligence, condition monitoring, deep learning, electric power system protection, fault detection, learning system, machine learning. |
|
Cluster6 |
Detection method, efficiency, monitoring, photovoltaic cells, photovoltaic panels, photovoltaic system, photovoltaic systems, solar photovoltaic system. |
Cluster 1 emphasizes carbon degradation, perovskite solar cells, photovoltaic technology, and renewable energy, highlighting sustainable development and the use of solar energy for electricity generation. Cluster 2 centers on battery management, electrical control systems, energy transmission, electric vehicles, and energy storage, addressing issues related to fossil fuels, lithium-ion batteries, and smart electrical grids. Cluster 3 focuses on electric power converters, electric drives, neural networks, and circuit reliability, dealing with fault detection, fault tolerance, and power electronics system topologies. Cluster 4 covers controllers, electrical fault currents, energy conversion, fuel cells, microgrids, as well as power quality, reactive power, and sliding mode control. Cluster 5 revolves around artificial intelligence, deep learning, state monitoring, and machine learning, targeting power supply protection and fault and failure detection. Finally, Cluster 6 concentrates on detection methods, efficiency, monitoring, photovoltaic cells, panels, and systems, specifically addressing fault detection and diagnosis in photovoltaic solar energy. The last two clusters primarily focus on PV fault diagnosis and related methodologies.
Moreover, human involvement in AI and the explainability of AI are less evident in several clusters outlined in the table. However, Cluster 5 focuses on machine learning, deep learning, and artificial intelligence, while also considering state monitoring and the protection of electrical power systems, implying human intervention to ensure system safety and reliability. Similarly, Cluster 6 addresses the detection and diagnosis of faults in photovoltaic systems, necessitating human interpretation of results and informed decision-making.
b. Co-occurrence of keywords by authors
In this map depicted in Figure 6, associations of keywords by author are linked to each other through three clusters. Similar to the previous case, the degree of co-occurrence of keywords, indicating their simultaneous appearance, is influenced by their proximity and similarity. Table 9 provides an overview of the clusters associated with the map.
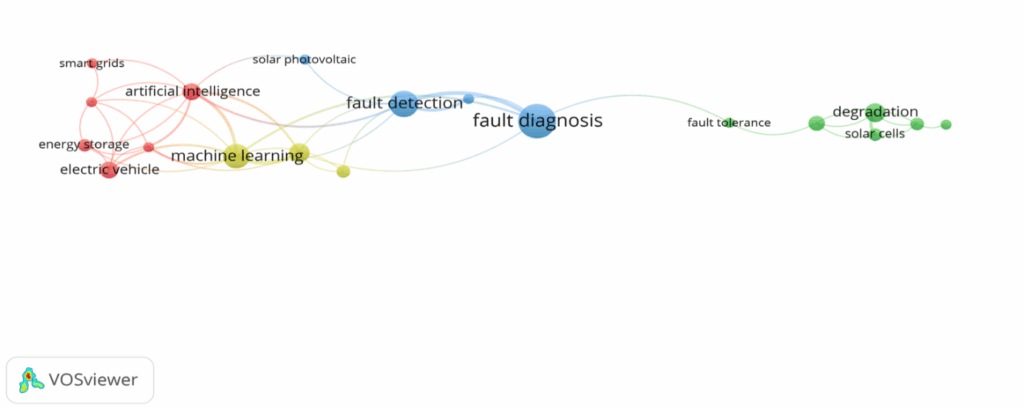
Table 9: Clusters of Authors’ Co-occurring Keywords illustrate diverse research focuses in photovoltaic systems, encompassing AI applications, system reliability, fault detection, and optimization for sustainable energy solutions.
| N cluster | Node |
|
Cluster1 |
Artificial intelligence, electric vehicle, energy storage, power electronics, prediction, smart grids |
|
Cluster2 |
Degradation, fault tolerance, photovoltaics, reliability, solar cells, solar energy, |
| Cluster3 | Fault detection, fault diagnosis, fault location, solar photovoltaic |
| Cluster4 | Deep learning, machine learning, photovoltaic systems |
Cluster 1 focuses on the applications of artificial intelligence, power electronics, and energy storage systems in smart electrical grids and electric vehicles. The authors of this cluster may be experts in areas such as machine learning, signal processing, and electrical system design. Research trends in this cluster may include the development of new machine learning algorithms for energy demand prediction, electric vehicle charging optimization, and energy management in smart grids or microgrids.
Cluster 2 focuses on the reliability and sustainability of photovoltaic systems, with a particular emphasis on degradation, fault tolerance, and reliability assessment. The authors of this cluster have expertise in materials, photovoltaic system design, and degradation modeling. Research trends in this cluster may include the development of new materials and system designs to improve the lifespan of photovoltaic systems, as well as the use of machine learning techniques to predict degradation and assess reliability.
Cluster 3 is centered on the detection, diagnosis, and localization of faults in photovoltaic systems. The authors of this cluster may be experts in signal processing, photovoltaic system design, and fault modeling. Research trends in this cluster include the development of new intelligent algorithms for fault detection and localization, as well as the use of machine learning techniques for fault diagnosis and classification.
Cluster 4 focuses on the applications of deep learning and machine learning in photovoltaic systems, with a particular emphasis on energy production prediction and system optimization. The authors of this cluster have expertise in machine learning, signal processing, and photovoltaic system design. Research trends in this cluster are focused on the development of new deep learning algorithms for energy production prediction and system optimization, as well as the use of machine learning techniques for fault detection and diagnosis.
Overall, the results of the cluster analysis suggest that research in the field of photovoltaic systems is diverse and rapidly evolving. Researchers are focusing on a wide range of topics, from the reliability and sustainability of systems to the optimization and prediction of energy production. The increasing use of machine learning and deep learning in photovoltaic research is also evident, with many authors exploring the applications of these techniques in fault detection. Furthermore, these results highlight the importance of collaboration and interdisciplinarity in photovoltaic research. Researchers need to work together to combine their expertise in materials, system design, signal processing, and machine learning to address the complex challenges facing the photovoltaic industry. Additionally, the research trends in the clusters suggest that the use of machine learning and deep learning in fault detection and diagnosis remains a promising avenue for improving the reliability and sustainability of photovoltaic systems.
3.2.2. Thematical Map and Thematic Evolution
To identify key research themes, keyword co-occurrence analysis is used to trace thematic evolution [76]. Each cluster reflects a conceptual theme, with the research period considered. Callon centrality measures inter-cluster connections, while Callon density assesses their internal strength and influence over time [77]. The size of each sphere in the diagram corresponds to the frequency of publications on that theme. The resulting strategic diagram places these sub-clusters in a two-dimensional space, offering a global view of the field’s thematic evolution [78].
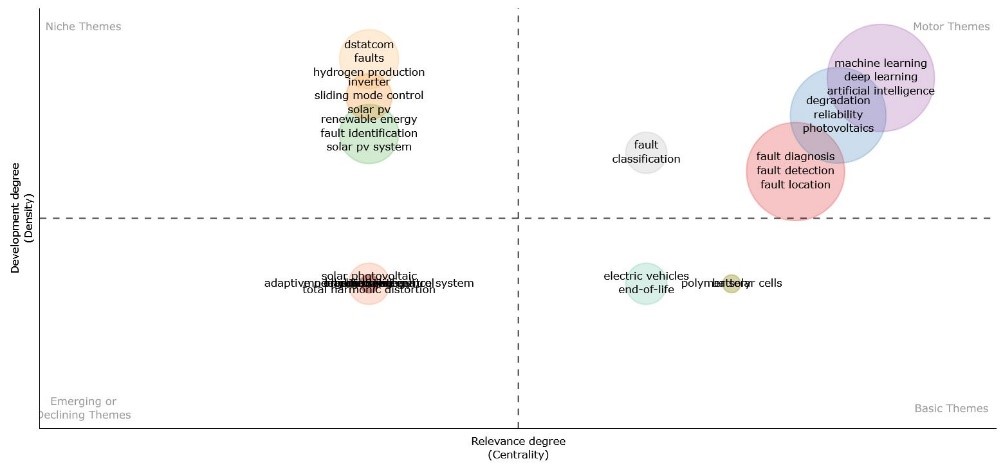
Using keyword co-occurrence analysis to identify thematic trends in the research field, we generated a strategic map highlighting the main themes over the studied period (see Figure 7). The most frequent keywords, derived from author keywords, were analyzed. This analysis revealed ten themes, with four grouped into primary clusters. The first cluster comprising machine learning, deep learning, and artificial intelligence centers on AI techniques aimed at enhancing solar energy production systems. The second cluster, including degradation, reliability, and photovoltaics, addresses the durability and reliability of photovoltaic systems. The third cluster focuses on fault detection and location, featuring keywords such as fault degradation, fault detection, and fault location. Lastly, the fourth cluster pertains to fault classification within photovoltaic systems.
Examining these keyword clusters, it is clear that they all converge towards a central theme: the diagnosis/prognosis of solar panel defects using artificial intelligence. This trend reflects the growing importance of using artificial intelligence to improve the reliability and performance of photovoltaic systems, as well as to reduce maintenance and repair costs.
4. Issues Identified, Key Challenges and Future Directions
To interpret the results and the color legends of keywords in this figure, readers are referred to the corresponding colors.
Utilizing keyword co-occurrence analysis to identify thematic trends in a research field, we constructed a strategic map delineating the main themes for the studied period (refer to Figure 7). We considered the most frequent keywords in relation to author keywords. In this depiction, ten themes were identified, four of which were amalgamated into primary clusters.
The first cluster (machine learning, deep learning, artificial intelligence) concentrates on leveraging machine learning and artificial intelligence techniques to enhance the efficiency of solar energy production systems. The second cluster (degradation, reliability, photovoltaics) delves into the reliability and durability aspects of photovoltaic systems. The third cluster (fault degradation, fault detection, fault location) revolves around the detection and localization of faults within photovoltaic systems. Lastly, the fourth cluster (fault classification) pertains to the classification of faults within photovoltaic systems.
Upon scrutinizing these keyword clusters, it becomes apparent that they all converge towards a central theme: the diagnosis/prognosis of solar panel defects using artificial intelligence. This trend underscores the increasing significance of employing artificial intelligence to enhance the reliability and performance of photovoltaic systems while mitigating maintenance and repair costs.
Identified Problems, Key Challenges, and Future Directions in the Implementation of Explainable Artificial Intelligence and Active Learning for Solar Panel Defect Prognosis
Addressing the question of current trends in explainable AI in PV fault diagnosis/prognosis, it’s essential to acknowledge that challenges associated with deploying AI systems on photovoltaic solar systems can stem from operational, organizational, technical, and data-related factors, alongside interpretability, transparency, and trust. However, our findings indicate that explainable AI (XAI) remains underutilized in the deployment of AI algorithms for PV fault prognosis. This is evidenced by the scant presence of XAI among the most cited keywords, the limited number of documents and authors retrieved from the Scopus database, and the minimal collaboration between institutions in this specific field.
Concerning human involvement in the machine learning process to emphasize active learning, a similar observation arises. Active learning, an AI method necessitating human interaction to refine algorithmic efficiency and accuracy, encounters challenges primarily related to data collection [36]. While data is pivotal for machine learning, its collection remains a formidable challenge. Human involvement, in various forms such as labeling data selected by algorithms or providing feedback on algorithmic results, is essential to optimize the learning process and enhance algorithmic performance. However, our findings indicate that active learning remains underutilized in the detection, diagnosis, and prognosis of solar panel defects.
Regarding the main challenges related to the application of AI methods in the prognosis of the lifetime of PV systems, several key points emerge:
- The availability and quality of data are paramount for training AI algorithms. Data must be massive, secure, accessible, and of high quality to ensure accurate predictions. Advanced data collection techniques such as drone-based or wireless sensor data collection can alleviate this challenge. Moreover, human involvement in labeling significant data can facilitate user understanding.
- PV systems are complex, influenced by numerous factors like solar irradiation, temperature, and humidity. Advanced AI models such as deep neural networks are increasingly being used to account for these complexities, yet there remains a gap between their precision and user-friendliness.
- The interpretability of AI models is crucial. While accurate, AI models can be challenging to interpret, hindering informed decision-making. Explainable AI techniques such as decision trees can enhance model interpretability and facilitate informed decision-making.
In summary, addressing challenges related to AI methods in PV system prognosis necessitates considering advanced data collection techniques, complex AI models, explainable AI techniques, and continuous model learning and adaptation. Recent studies have shown that these approaches can enhance the accuracy and interpretability of AI models, thus facilitating informed decision-making regarding PV system maintenance and replacement [79-80].
5. Discussion
In this section, we’ll delve into the future trends and benefits of our bibliometric study on the use of artificial intelligence (AI) for detecting and diagnosing anomalies and defects in modern photovoltaic systems (PV), alongside presenting the limitations of this work.
Our bibliometric study has shed light on the promising emergence of Explainable Artificial Intelligence (XAI) and active learning as means to enhance the transparency and comprehension of AI methods applied to photovoltaic systems. Particularly, integrating human expertise in the data labeling process has proven to be a decisive simplifying approach for effective AI utilization in this field. The benefits of XAI and active learning have been substantiated by several recent studies, showcasing their potential to augment the accuracy and reliability of AI methods deployed in the photovoltaic domain. Moreover, our analysis has unveiled the predominant influence of China in the realm of explainable AI applied to photovoltaic systems. This dominance can be attributed to the pronounced focus of Chinese universities on research in this sector, coupled with China’s status as the world’s leading producer of solar panels. However, our study has also underscored a notable underinvestment in the domain of AI explainability (XAI) concerning solar panels. Additional initiatives aimed at exploring the utilization of XAI in this field are advocated to enhance the transparency and understanding of the employed AI methods.
Regarding future trends, we anticipate a continuous proliferation in the utilization of AI for detecting and diagnosing anomalies and failures in modern photovoltaic systems. Specifically, the ascendancy of deep learning and machine learning is projected to persist in this domain, owing to their capacity to process vast datasets and identify intricate patterns that would be challenging to discern using conventional methods.
Lastly, we believe that our study confers several benefits. Firstly, it furnishes a comprehensive overview of AI utilization in the photovoltaic systems domain, with particular emphasis on XAI and active learning. Furthermore, our work accentuates the advantages of incorporating human expertise in the data labeling process, thereby significantly facilitating AI utilization in this context. Lastly, our study identifies promising trends and research directions in this field, which can guide future endeavors for both researchers and practitioners.
5.1. Limitations
While this bibliometric study has provided valuable insights into the utilization of AI in detecting and diagnosing defects in photovoltaic systems, it bears certain limitations.
Primarily, the study focused solely on articles published in journals and conferences, thereby overlooking research works published as technical reports, theses, or patents. This might have led to an underrepresentation of certain trends or developments in the field. Additionally, employing specific keywords to identify relevant articles may have excluded pertinent works that did not utilize these keywords, potentially introducing a bias towards certain AI methods or approaches. Furthermore, the utilization of a single database, namely Scopus, may be perceived as a limitation, as it might not encompass all relevant publications in the domain of AI applied to photovoltaic systems. Lastly, the study exclusively focused on articles published in English, potentially excluding relevant articles published in other languages.
In summary, these limitations warrant consideration when interpreting the results of this bibliometric study. Future research could broaden the scope of the study by incorporating additional data sources such as Web of Science, IEEE Xplore, or Google Scholar, adopting different keywords, and considering languages other than English.
5.2. Future Word Orientation
To enhance the results and steer advancements and initiatives in the studied field, we propose the following recommendations:
- Encourage research on Explainable AI and Active Learning in the domain of photovoltaic systems to bolster the transparency and understanding of AI methods utilized.
- Develop standards for Explainable AI in photovoltaic systems to ensure the transparency, comprehensibility, reliability, and accessibility of the employed AI methods.
- Foster collaboration between AI researchers and solar energy experts to develop effective AI methods tailored to photovoltaic systems, emphasizing interdisciplinary collaboration to grasp the challenges and opportunities in this domain.
6. Conclusion
In conclusion, this bibliometric study has underscored the significance of explainable AI and active learning in detecting dysfunctions in photovoltaic systems. Despite the rapid increase in publications in this field, the majority of proposed methods often overlook the explainability aspect of AI and the necessity for human interaction in the learning process. This oversight has resulted in a proliferation of AI methods in theory but limited real-world applications. Additionally, we’ve identified key players in this domain, including prolific authors, active countries, and fruitful collaborations. These findings serve as a valuable resource for researchers to discern current trends and gaps in the literature and to forge productive collaborations to propel the field forward.
Based on our results, we have formulated several recommendations to improve future research. Firstly, it is crucial to consider the explainability aspect of AI in methods for detecting dysfunctions in photovoltaic systems. Secondly, integrating human interaction in the learning process is essential to enhance the accuracy and reliability of the proposed methods. Finally, encouraging collaborations between researchers, domain engineers, and social scientists is vital to develop more effective and practically applicable methods.
In summary, this bibliometric study has emphasized the significance of explainable AI and active learning in detecting dysfunctions in photovoltaic systems, while also highlighting current gaps in the literature. The proposed recommendations aim to facilitate the development of more effective and applicable methods, thereby contributing to the global energy transition towards more reliable and sustainable renewable energy sources.
Conflict of Interest
The authors declare no conflict of interest.
Acknowledgment
- The authors are grateful to Patrice ELE ABIAMA, Head Manager of the National Committee for Development of Technologies (CNDT)/ Ministry of Scientific Research and Innovation (Cameroon) for his valuable help and his supervision.
- The authors thank the Production Engineering Laboratory (LGP) of the National School of Engineers of Tarbes (ENIT) and also Institut Universitaire de la Cote (IUC) for the technical and material support during the evaluation and the redaction of this work.
- Y. Kulkarni; A. Mahamuni; S. Sane; P. Kalshetti; K. Patil; R. Jarad, “Analysing How Marketing Management and Artificial Intelligence are used to Change Customer Engagement,” in 2024 International Conference on Trends in Quantum Computing and Emerging Business Technologies, 1-6, 2024, doi: 10.1109/TQCEBT59414.2024.10545064.
- N. Rane, M. Paramesha, S. Choudhary, J. Rane, “Artificial Intelligence in Sales and Marketing: Enhancing Customer Satisfaction, Experience and Loyalty,” Advances in Artificial Intelligence, 17, 2024. doi: 10.18178/JAAI.2024.2.2.245-264.
- K. Dhiwar, M. Bedarkar, “Circular Economy for Fashion Waste in the Indian Fashion Industry: Challenges and Opportunities,” Fashion Practice, 16(3), 344, 2024. doi.org/10.1080/17569370.2024.2393495.
- R. Gill, P. Kumar, M. Patel, H. Kumar, “Integrating Marketing Data Ecosystems: Merging Diverse Data Sources for Holistic Insights,” , Data Engineering for Data-driven Marketing, Emerald, 2025.
- S. Verma, R. Sharma, S. Deb, and D. Maitra, “Artificial intelligence in marketing: Systematic review and future research direction,” Information Management Data Insights, 1, 100002, 2021. doi.org/10.1080/17569370.2024.2393495.
- M. Shaffer, I. Okundaye, Marketing, Sales, and Distribution, Innovation in Nephrology, Elsevier, 2025.
- H. Sarker, “Machine Learning: Algorithms, Real-World Applications and Research Directions,” SN Computer Science, 2, 160, 2021. doi: 10.1007/s42979-021-00592-x.
- H. Gacanin, M. Wagner, “Artificial intelligence paradigm for customer experience management in next-generation networks: Challenges and perspectives,” IEEE Network, 33(2), 188–194, 2019. doi: 10.1109/MNET.2019.1800015.
- Q. Nguyen, A. Sidorova, “Understanding user interactions with a chatbot: a self-determination theory approach,” in 2018 AMCIS Proceedings, 3, 2018.
- A. Maxwell, S. Jeffrey, M. Lévesque, “Business angel early-stage decision making,” Business Venturing, 26(2), 212–225, 2011. doi.org/10.1016/j.jbusvent.2009.09.002.
- S. Chatterjee, S. Ghosh, R. Chaudhuri, B. Nguyen, “Are CRM systems ready for AI integration? A conceptual framework of organizational readiness for effective AI-CRM integration,” The Bottom Line, 32(2), 144–157, 2019. doi.org/10.1108/BL-02-2019-0069.
- R. Seranmadevi, A. Kumara, “Experiencing the AI emergence in Indian retail – Early adopters approach,” Management Science Letters, 9, 33–42, 2019. doi: 10.5267/j.msl.2018.11.002.
- W. Wisetsri, C. Aarthy, V. Thakur, D. Pandey, K. Gulati, “Systematic Analysis and Future Research Directions in Artificial Intelligence for Marketing,” Computer and Mathematics Education, 12(11), 43-55, 2021. doi: 10.17762/turcomat.v12i11.5825.
- S. Nazim, M. Rajeswari, “Creating a Brand Value and Consumer Satisfaction in E-Commerce Business Using Artificial Intelligence with the Help of Vosag Technology,” Innovative Technology and Exploring Engineering (IJITEE), 8(8), 2019.