TETRA™ Techniques to Assess and Manage the Software Technical Debt

Adv. Sci. Technol. Eng. Syst. J. 6(5), 303–309 (2021);
 DOI: 10.25046/aj060534
The paper examines the company’s proprietary means for determining the quality of a software product and measuring its technical debt. The paper’s authors explain how a software product’s quality is directly correlated with the amount of varying technical debts that the end-users receive. All debts can be paid, and technical debt is no exception: one can use various parameters, techniques, and dimensions to effectively measure and optimize the quality of a software product. The authors share information about the company’s proprietary method to technical debt management, which is done via the Technical dEbT Reduction plAtform, otherwise known as TETRA™. They give details about the assessment’s major dimensions, tools, and measurement parameters.
1. Introduction
Whether you’ve been a part of the software development industry for decades or just a few years, you’ve probably had to explain software quality to your clients. Everybody talks about software quality, but it’s understood differently from person to person. Some define quality as the level of client satisfaction, while others say it’s just about meeting the customer’s requirements. And in the tech world, it’s more about the software being free of any defects. We find the latter to be more realistic; however, it can raise even more concerns. At Intetics, we decided to clear up any understandings by carrying out intensive research: we aimed to determine what the quality of a software product is and how it can be managed efficiently. Throughout our investigations, we discovered that a software product’s quality is directly correlated to the product’s amount of varying technical debts that are passed on to end-users.
Best practices within the software development industry state that technical debt is any code added now that will take more work to fix later on. This kind of code is usually added to achieve rapid gains. The source code is one of the most important aspects of software. After all, the higher the number of problems within the source code, the more redevelopment is needed [1]. That’s how the software development industry understands technical debt – and we agree. However, after dealing with technical debt for many years, we started to think about it differently. After thorough examination, we came to the conclusion that technical debt is “a combined product non-compliance with technical guidelines and business objectives that negatively impact business results.”
Technical debt can be further divided into three categories: intentional, unavoidable, and unintentional.
- Intentional tech debt: As a business strategy, this kind of debt is knowingly taken on. If intentional debt is kept at bay, it’s acceptable.
- Unavoidable tech debt: This kind compiles as a result of external factors, such as when you need to adapt your software after a third-party system upgrade.
- Unintentional tech debt: It stems from negligence. It might happen if several developers are simultaneously working on one solution and one error is layered over another.
There are also various kinds of tech debt types based on the debt’s cause. Some causes include people debt, automation test debt, documentation debt, and requirement debt, among others [2].
A growing volume of technical debt in the project is usually a consequence of cutting corners during the project’s early stages. It can stem from minor defects in the codebase, environment setup, documentation, or chosen third-party software. And as the impact of these early errors grows, refactoring is necessary – likely rewritten or adjusted to ease further development and maintenance. The development team has to work with tech debt while the software is already developed, released, and being actively used. And if the tech debt is not addressed in time, it will gradually build up, threatening to take down the whole software product.
The costs of technical debt can be quite significant; the cost of technical debt for an average application with 300,000 lines is just over $1 million, according to a report from CAST software. What’s more, the repercussions can go beyond high costs. Take, for instance, an NHS glitch in 2018 – in this case, over 10,000 patients were at risk of being given the wrong medication.
For any software product, it is natural to accumulate some amount of technical debt in the development process. Therefore, it makes academic and practical sense to manage tech debt. Various reviewed sources suggest that technical debt should be managed within the Agile Triangle, where there are three different dimensions – budget, time, and scope [3] – conflicting since it is not feasible to develop high-quality software with a low budget in a short time. So, as shown in Figure 1, if we are focused on one corner, we are going to weaken the other two.
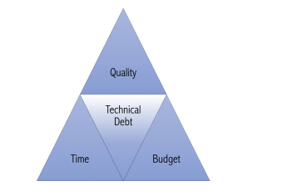 Figure 1: Agile Triangle
ª Agile Triangle figure is taken from source [3].
But there are also more specific approaches that highlight the following steps:
- Identifying;
- Measuring;
- Prioritizing;
- Preventing;
- Monitoring;
- Repaying;
- Representing/Documenting;
- Communicating [4].
However, there is no commonly accepted theory of technical debt identification. Yet, technical debt is present in any real project – whether or not the developers recognize it as its own entity. That had encouraged us to propose our own different model.
While developing the model, we spent thousands of hours investigating and defining crucial aspects of software product quality that allow us to get a better perspective and measurement of technical debt. We used these dimensions to form the foundation of our platform for software quality assessment: TETRA™ (Technical dEbT Reduction plAtform). And why did we name it TETRA™? Technical debt is akin to tiny TETRA™ fish with thousands of species. That might be like small and insignificant at first glance trade-offs. Even though these “locally beautiful” quick solutions are easy to implement, they aren’t the ideal solution overall. As technical debt compiles, you’ll have to pay “interest” – in other words, more challenging maintainability, a less enjoyable user experience, worse productivity across your development team, and increased costs overall. We cram all those fish into one fishbowl: the TETRA™ platform. So, how do we decide what matters in software products? Is it possible to assess both the business and technical sides?
We measure and assess both sides using a specific set of tools and techniques, chosen based on original research from Intetics, best practice analysis, and expertise gained throughout multiple projects. The results enable us to calculate a software product’s overall technical debt and its specific parameters. To get the big picture, we use eight dimensions to assess the product; each dimension is judged on a five-point scale. This enables uniform results and allows summary assessments to be obtained – for the product itself and for each dimension. Ranges of values were set for each metric – experimental and directly calculated, which acted as a scoring system. The final product quality assessment calculation was done via a weighted parameters system. The parameters determined the roles that each dimension would play in the overall score.
The final assessment is given within a table containing numbers and indices for each metric. The most advantageous part of using the TETRA™ methodology is that indices are introduced, rather than exact numbers. Thus, further investigation can be carried out based on the analysis of the TETRA™ Index, Metric Index, and Dimension Index.
Every value was given a letter score and color. The highest letter grade is A, which means that the parameter’s component had no technical debt. The lowest, E, flagged the presence of critical problems that must be rectified before the product is worked on further.
An example of the assessment is shown in Figure 2. To see the big picture, we assess the product based on the following eight dimensions.
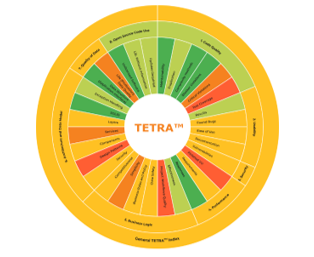 Figure 2: Example of TETRA™ assessment report.
ª Note. Own development.
2. TETRA™ Dimensions
2.1 Dimension 1
Source code quality includes not only the completeness and correctness of the required functionality’s implementation but also the ease of support and its modification [5]. It is evaluated by these parameters:
- Cyclomatic complexityof the code is a metric on which the complexity of the code maintenance directly depends and is calculated as the number of independent paths in the code.
- Duplicationsis one of the main characteristics that reflects how easy it will be in the future (or present) to make changes to the code. The fewer duplicates there are, the easier it will be to live with this code.
- The code coverage level is read as the ratio of the number of code points covered by the unit tests to the number of all existing ones.
- Rules complianceis the set of rules for compliance and conventions that verify the basic design principles for source code that’s shared by the development team.
- Maintainability indexis a software metric that measures how it`s easy to maintain the source code.
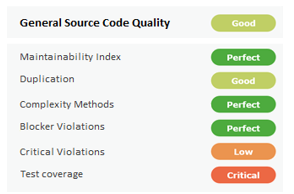 Figure 3: Source code quality assessment summary
Figure 3 shows the Summary Source Code Assessment results where the most pressing issues are related to the unit test coverage and critical rules compliance violations.
2.2 Dimension 2
Usability, UI & Documentation covers the assessment of a software product’s usability, UI, and documentation, as the name suggests. This process includes a checklist and expert assessment, which address learnability, memorability, likeability, error tolerability, and efficiency metrics [6]. In order to give an accurate assessment, we use Usabilla, Browser Shots, W3C Markup Validation Service, and other tools. A usability assessment example is shown in Figure 4, where you can see that the usability quality level is good.
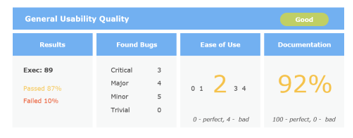 Figure 4: Usability assessment summary.
2.3 Dimension 3
Security delves into product vulnerabilities related to BID, CERT, OSVDB, CVE, CWE, and OWASP [7]. We use automated and manual approaches within the security assessment, using tools like OWASP ZAP, Burp Suite, and Nessus [8, 9]. An example of the security assessment is shown in Figure 5; 8 vulnerabilities were found there, giving the software a medium security quality level.
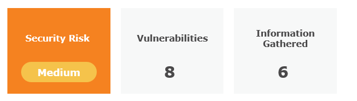 Figure 5: Security assessment summary
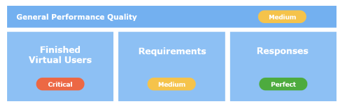 Figure 6: Performance assessment summary
2.4 Dimension 4
Performance assessment is the evaluation of whether the product meets the customer’s requirements. We perform the assessment through load testing and by simulating the activity of virtual users. We use tools like LoadUI Pro, WebLoad, JMeter, and LoadRunner to assess certain performance parameters, including peak and average response times, concurrent users, and a separate set of server-state assessment parameters. An example of the performance assessment is shown in Figure 6. The most impact on the final evaluation was made by the fallen virtual users.
2.5 Dimension 5
Business logic assessment determines whether software aligns with necessary business processes. This kind of assessment considers feedback from various focus groups, including customers, end-users, community, management, etc. The business logic assessment relies on six main metrics: data safety, project workflow quality, effectiveness, simplicity, business rules and policy, and competitiveness. An example of the business logic assessment is shown in Figure 7.
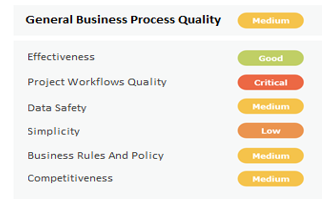 Figure 7: Business logic assessment summary.
2.6 Dimension 6
Architecture quality assessment contains an expert’s conclusion regarding the data model and core structure of the software. During the assessment’s administration, we analyze services, layers, exception handling, design patterns, infrastructure and recycling components, and more [10, 11].
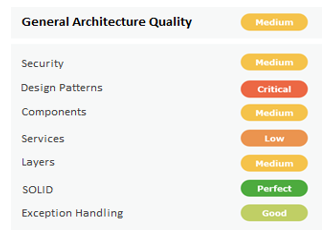 Figure 8: Architecture assessment summary.
2.7 Dimension 7
Data quality encompasses a product’s resistance to bad data, how it handles exceptions, and its bad data preventative measures. We base the assessment on metrics like completeness, timeliness, validity, currency, accuracy, consistency, and accessibility. To ensure the assessment’s accuracy, we use manual testing and the Talend Open Studio. An example of the data quality assessment is shown in Figure 9. In this dimension, both metrics were assessed at the medium level.
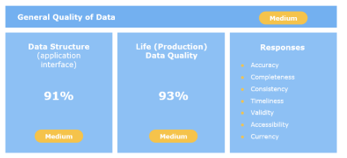 Figure 9: Data quality assessment summary.
2.8 Dimension 8
Open-source code use assessments find any open-source components contained in the software product. We included this dimension to pinpoint any operational, legal, security, or copyright issues that could occur from using open-source components. Inside the report, we give a list of all copyrights, open-source code, and licenses used in the software product. Furthermore, we analyze the software’s open-source version. The assessment is done with Black Duck, Palamida, and other tools. See Figure 10 for an example of an assessment of open-source code. The biggest problems were caused by the inclusion of unlicensed software.
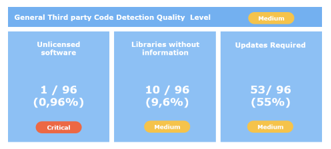 Figure 10: Open source code use assessment summary.
By using this method of analyzing and measuring technical debt, we create the final report that describes each weakness and determines the product’s quality.
Because these dimensions significantly impact business needs, they must be communicated to stakeholders. Each component can be checked independently, and some might not be applicable to certain products. Separating technical debt dimensions necessitates manual action and review from a personal expert to be factored into the final scoring. We consider this to be less of a problem than not estimating a software product’s technical debt.
3. Advantages of TETRA™
Using TETRA™’s framework to expand the concept of technical debt brings benefits to developers and all stakeholders. By understanding the total technical debt, the following can be achieved:
- Managers are able to observe whether project management is effective. They can identify bottlenecks that are currently hindering the project’s development or could become a problem in the future.
- Designers and developers get an unbiased third-party report on project coherence and code quality.
- Investors who are presented with the TETRA™ evaluation can use it as an additional quantifiable justification for product investment.
- Product owners can use TETRA™’s evaluation to assess the effectiveness of fund allocation to various development teams. Thus, they can place priorities within product development areas or decide to conserve until the technical debt has been removed.
4. Limitations of TETRA™
However, TETRA™ is not a one-size-fits-all solution, nor is it a miracle. While it is a highly effective evaluation tool, it does have certain limitations, namely:
- While TETRA™ allows technical debt to be identified, it does not provide answers on how to minimize said debt. There will need to be further investigation into the causes of technical debt, and the management and development team must change their established practices.
- Because technical debt goes past quantifiable technical aspects of code quality (e.g., number of vulnerabilities/ defects per code volume), the process cannot be fully automated and needs subjective, expert assessment.
- In order to minimize technical debt, TETRA™ assessments will be required on a regular basis.
5. TETRA™ Use Case: E-Learning Platform
One of our EdTech clients wanted to innovate and revamp its e-learning platform with the goal of adding to its user base and improving its market value.
The companies target audience consists of students and graduates who are studying English and trying to improve their language skills. Most of the platform’s users are tech-savvy kids, teenagers, and young adults who are comfortable with modern technologies.
To ensure the platform was a good fit for their target audience, our client needed to measure its current technical capabilities and business efficiency before introducing new features.
The project contained about 120,000 lines of code and 7 logic sections/modules. 5 developers and 2 QA developed the platform for 2+ years. A wide array of tools and technologies were used, including Spring Boot, Angular, Java, MySQL, Git, Jenkins, and jQuery.
A profound platform assessment was required, so the client chose us for our extensive expertise; they requested that we carry out an unbiased analysis.
To meet the client’s needs, we applied the proprietary TETRA™ approach to their platform, analyzing all eight components outlined in Section 2. Each stage of the assessment concluded with a report about the product’s bottlenecks and pain points. The process took 2 months from start to finish.
Throughout the TETRA™ analysis, we found several areas that the client was satisfactory in, including their open-source code use and source code quality. However, there were also several areas that needed improvement: the platform had a medium security risk, as well as poor architectural, performance, and business logic elements.
See results in table the Final TETRA™ report below.
Table 1: The final TETRA™ report
| Metric | Assessment Result | Evaluation
Rank |
Score | Metric
Index |
Dimension Index | General TETRA™ Quality Index |
| TETRA™ Eight (8) Dimensions of Quality | С
|
|||||
| 1. Source Code Quality | B | |||||
| Unit Test Coverage | 0 | X < 40 | 5 | E | ||
| Critical Violations | 44 | 40 < X < 60 | 4 | D | ||
| Duplication | 4.30% | 4% < X < 5% | 2 | B | ||
| Maintainability index | 1.9% | 0 < X < 2.1 | 1 | A | ||
| Complexity Methods | 4.40% | 0 < X < 5% | 1 | A | ||
| Blocker Violations | 0 | X = 0 | 1 | A | ||
| 2. Usability, UI & Documentation | C | |||||
| Documentation | Failed: 9%, Failed weight: 15% |
Failed: 5% < X < 10% Weight: X < 20 | 3 | C | ||
| Found Bugs | Trivial: 4, Minor: 20, Major: 2 |
Major – Worst priority | 3 | C | ||
| Ease of Use | Score: 3 | X = 3 | 3 | C | ||
| UI Results | Failed: 8%, Failed weight: 10% |
Failed: 5% < X < 10% Weight: X < 20 | 2 | B | ||
| 3. Security | C | |||||
| Vulnerabilities | Trivial: 3, Medium: 4 |
Medium – Worst priority | 3 | C | ||
| 4. Performance | C | |||||
| Finished Virtual Users | 10% | < 85% | 5 | E | ||
| Customer Requirements | 85% | 80% < X < 90% | 3 | C | ||
| Responses | 100% | X = 100% | 1 | A | ||
| 5. Business Logic | C | |||||
| Project Workflows Quality | 23% | X < 25% | 5 | E | ||
| Simplicity | 30% | 25% < X < 50 % | 4 | D | ||
| Data Safety | 67% | 50% < X < 75% | 3 | C | ||
| Bussiness Rules and Policy | 57% | 50% < X < 75% | 3 | C | ||
| Competitiveness | 63% | 50% < X < 75% | 3 | C | ||
| Effectiveness | 80% | 75 % < X < 90% | 2 | B | ||
| 6. Architecture Quality | C | |||||
| Design Patterns | 25% | X < 30% | 5 | E | ||
| Services | 41% | 30% < X < 50% | 4 | D | ||
| Security | 65% | 50% < X < 70% | 3 | C | ||
| Components | 59% | 50% < X < 70% | 3 | C | ||
| Layers | 63% | 50% < X < 70% | 3 | C | ||
| Exception handling | 85% | 70% < X < 90% | 2 | B | ||
| SOLID | 98% | 95% < X | 1 | A | ||
| 7. Data Quality | C | |||||
| Real-slice (Production) Data Quality | 58 % | 50% < X < 60% | 4 | D | ||
| Requirements Data Quality | 96% | 95% < X | 1 | A | ||
| 8. Open Source Code Use | B | |||||
| Lib. Without information | 8% | 5% < X < 10% | 2 | B | ||
| Updates Required | 8% | 5% < X < 10% | 2 | B | ||
| Unlicensed software | 0% | X = 0% | 1 | A | ||
ª Note. Own development
6. Results
The final TETRA™ report is illustrated in the Table above, which demonstrates that the overall platform state was “Medium,” showing the value “C” of the TETRA™ Index. Simultaneously, a detailed results interpretation showed that functionality updates sometimes lead to software crashes.
By carrying out the analysis, we were able to give the client the bigger picture about their platform; they understood which areas needed enhancements and were able to avoid crashes resulting from future updates.
We provided the client with a detailed list of recommendations, which the client followed. As a result of the improvements, the platform’s user-base grew by 17.3%, and product redevelopment costs were cut by 22%.
7. Conclusion
TETRA™ isn’t just applicable for tech experts – it benefits everybody who works on a product. Testers and developers alike receive an unbiased assessment of their work, users get a well-performing, reliable product, and managers get a better idea of the product’s capacity. Furthermore, the processes used within the assessment encourages best practices from the team, thus increasing team proficiency – and thereby the product’s quality
TETRA™ gives proper business information to product owners and investors. Companies can get a fair analysis of their product and determine whether it’s ready to be launched. If the product already works as intended, the owners can get an estimate of its market value and efficiency. And regarding investors, TETRA™ enables them to better define the product’s market value, evaluate the state of the purchasable product, and determine potential investment risks for a transaction.
Throughout the development of TETRA™, we had the overall goal of quantitatively evaluating software product conditions and helping development teams get better results. If you don’t use comprehensive, standardized measurements, it isn’t possible to understand and manage the product’s quality. TETRA™ determines whether the needs of the investors, market, development teams, product owners, and users have been met. It allows you to efficiently take control of your project.
Conflict of Interest
The authors declare no conflict of interest.
Acknowledgment
Intetics vision of the outsourcing and custom software development industry involves heightened innovation brought to life through Intetics’ TETRA™ platform, as well as our proprietary Remote In-Sourcing® and Offshore Dedicated Team® models. Intetics is more than just software development; we aim to make an impact by sharing best practices with the global IT community and for different industries. The research was performed under the leadership of Boris Kontsevoi, President & CEO, and Sergei Terekhov, Director of Quality Assurance, based on the unique developed methodology for assessing technical debt.
- G. A. Campbell, P. P. Papapetrou, and O. Gaudin, “SonarQube in Action,” 1st Edition, Manning Publications, 392, 2013, ISBN-13: 9781617290954.
- N. S. R. Alves, L. F. Ribeiro, V. Caires, T. S. Mendes and R. O. Spínola, “Towards an Ontology of Terms on Technical Debt,” 2014 Sixth International Workshop on Managing Technical Debt, 1-7, 2014, doi: 10.1109/MTD.2014.9.
- P. Ciancarini, D. Russo, “The strategic technical debt management model: an empirical proposal,” In: V. Ivanov, A. Kruglov, S. Masyagin, A. Sillitti, G. Succi (eds) Open Source Systems, OSS 2020, IFIP Advances in Information and Communication Technology, 582, Springer, Cham, 131-140, 2020, doi: 10.1007/978-3-030-47240-5_13.
- J. Yli-Huumo, A. Maglyas, K. Smolander, “How do software development teams manage technical debt? – An empirical study,” The Journal of Systems and Software 120, 195-218, 2016, doi: 10.1016/j.jss.2016.05.018.
- A. Peixoto de Queirós, R. and A. Simões, and M. T. Pinto, “Code Generation, Analysis Tools, and Testing for Quality. Hershey,” PA: IGI Global, 288, 2019. doi: 10.4018/978-1-5225-7455-2.
- ISO/IEC 25063:2014, “Systems and software engineering — systems and software product quality requirements and evaluation (SQuaRE) — common industry format (CIF) for usability,” 1st Edition, ISO/TC 159/SC 4 Ergonomics of human-system interaction, 33, 2014.
- OWASP, “OWASP top 10 – 2017. The Ten Most Critical Web Application Security Risks,” OWASP Foundation, 25, 2017.
- CISQ, “List of Weaknesses Included in the CISQ Automated Source Code Quality Measures,” CISQ, 31, 2019.
- ISO/IEC 5055:2021, “Information technology — Software measurement — Software quality measurement — Automated source code quality measures,” 1st Edition, ISO/IEC JTC 1 Information technology, 235, 2021.
- Microsoft Patterns & Practices Team , “Microsoft Application Architecture Guide,” 2nd edition, Microsoft Press, 560, 2009, ISBN-13: 978-0735627109.
- P. C. Clements, R. Kazman, M. Klein, “Evaluating Software Architectures: Methods and Case Studies,” 1st edition, Addison-Wesley Professional, 323, 2002. ISBN: 0-201-70482-X.