Digitization Impact Assessment Model for Secondary Schools: Case of Nairobi County in Kenya

Adv. Sci. Technol. Eng. Syst. J. 4(3), 194–197 (2019);
 DOI: 10.25046/aj040326
Digitization is viewed as the capability to utilize digital technologies for generating processing, sharing and transacting information. Studies show that digitization has now become ubiquitous. In almost all the sectors, we routinely interact with digital technologies. As a result, the impact of digitization is being observed in such sectors. For instance, the positive impact of digitization in education sector includes more efficient administration, reduction in workload, better accessibility to information, better management of school resources and enhanced quality of reports. However, in the context of secondary schools, the literature is conspicuously silent on the formal way of assessing the impact of digitization on both the academic performance and service delivery. As an attempt to address the gap, this paper describes a model that can evaluate the impact of digitization in such schools. Python programming tools were used to demonstrate implementation of the model. The model can help governments to formulate policies related digitization of secondary schools and can also be used by funding organization to demonstrate accountability when making investment decisions.
1. Introduction
According to [1] digitization refers to the capability to utilize digital technologies for generating, processing, sharing and transacting information. Previous studies show that digitization in secondary schools is realized by integrating information communication technology(ICT) tools like School Management information systems (MIS) to enhance efficiency of providing administration services. Examples of such services are formulating strategic plans, evaluating staff performance, communication and distribution of resources [1, 2].
Integration of ICT tools in education calls for the development of indicators to monitor the impact of such tools. Both funding sources and the public can use the indicators assess accountability. In addition, there is a need for tools for indicating how use of technology in education is promoting empowerment, creativity, equality, efficiency among learners. Many academic researchers have attempted to address these needs at theoretical and empirical levels but have encountered two difficulties. First, student performance is hard to measure and still there is no common understanding about its definition. Second, ICT is characterized by changing or evolving technologies and their impacts are difficult to separate from their setting. Therefore, the association between the use of ICT and educational performance is not clear, and inconsistent findings are presented in the literature [3]. To address some of these difficulties our study aims at establishing an appropriate model for assessing the digitization level and its impact on education institutions including secondary schools.
2. Related Work
2.1. Digitization
Education is one of the important mechanisms that provide the necessary skills, competencies and knowledge among people. Consequently, research on factors influencing the academic performance of students in education institutions has become a topic of increasing interest. Previous studies have reported that digitization and the integration of ICT tools is one of the factors that are attributed to improvement of academic performance in secondary schools [5]. A recent report from the Education Council of the Netherlands has revealed that the education sector is still looking for the suitable level and appropriate methods of digitization [6]. This observation has created the need for establishing an appropriate index for measuring digitization level and its impact on education. Examples of existing models of indices include digitization index [7] and digitization impact index.
- Digitization Index (DiGiX)
According to [7], Digitization Index (DiGiX) can be described as a composite index for measuring the impact of digitization in societies such as learning institutions. This is a tool assessing the extent to which ICT is integrated in institutions[8]. Previous research work has been focused on developing indices that can assess digitization in a country. An example is Digitization Index proposed by [9] as tool for assessing the level digitization. This level can be measured using six main attributes. That is, (i) Ubiquity, which refers to the level of accessing universally digital applications and services by consumers and enterprises, (ii) affordability, which is described as the degree to which digital services are valued in a range that makes them available to a large population, (iii) reliability that is viewed as the quality of available digital services, (iv) speed, which is described as the extent to the degree to which digital services can be available in real time, (v) usability that is described as the simplicity of using digital services and the capacity of local ecosystems to improve utilization of these services and, (vi) skill that is viewed as the ability of users to incorporate digital services into their daily lives and businesses. Figure 1, illustrates how each of the metrics are related in digitization index.
- c) Digitization Impact Index
Digitization Impact Index can be described as the effect of digitization of a society such as a school or a country. In the context of a school, Digitization Impact index can be studied as an impact of digitization of a school in a user satisfaction model. In this case, the user is the staff or student who is directly impacted by the utilization of digital services in the school. Key indicators to compute their level of satisfaction are derived from the rating of the efficiency of services offered in the school which would be influenced by the level of digitization. According to [10] people are used to the concept of rating things with numerical scores and these can work well in surveys. Once the respondent has been given the anchors of the scale, they can readily give a number to express their level of satisfaction. Typically, scales of 1- 5 are used where the lowest figure indicates extreme dissatisfaction and the highest shows extreme satisfaction.
Several studies have observed that digitizing schools has an impact on education that can be measured using the following indicators:
- Improvement of students’ academic performance that is generally evaluated by the mark or grade attained by the student in an examination [5]
- Increase of enthusiasm, interest and creativity [5].
- Ease of system use like explaining concepts when cast on screen [5].
- The speed of information access increase as a result of internet infrastructure that support pervasive, simultaneous utilization of devices for instruction, evaluation, and school operations [12].
- The number of decisions to make increases. These include device acquisition, content options, the role of technology in supporting classroom management, security and privacy, and data management [12].
However, policy makers are confronted with two main challenges that are related to application of digital index. First, there are no standard performance indicators to measure the level at which ICT is incorporated in societies. The second challenge is that there is lack of instruments for measuring the impact of adopting mass connected digital technologies and applications in societies and economies [8]. Consequently, there is lack of a standard index for assessing the impact of digitization in secondary schools.
3. Proposed Model
As an attempt to address these challenges, we propose a model that can be used to assess the level and impact of digitization in a typical secondary school. The model was derived by combining a composite digitization index proposed by [9] with indicators of digitization impact stated by [5, 12]. This is shown in Figure1.
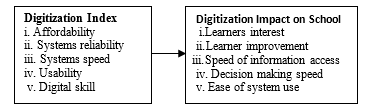 Figure1: Digitization impact conceptual model
As illustrated in Figure1, digitization index is representing independent variable for describing the level of digitization in a typical a secondary school. On the other hand, digitization impact on the school index represents the dependent variable. The proposed model can also be illustrated using simple regression equation of the form, Y= a + b1X1, where Y is the digitization impact index on the school , a is the constant parameter, b1 is the parameter to be estimated and variable X1 is the digitization index, an independent variable.
4. Significance of the Study
There are three main benefits that are associated with the proposed model. First, it can be used by the government to formulate policies related digitization of secondary schools, particularly in the African contexts like Kenya. The second benefit is that it can be used by funding organization to demonstrate accountability when making investment decisions [3]. The third benefit is that it can be used by school managers to assess the impact of integrating ICTs in a typical secondary school.
5. Study Method
According to [13] as cited in [14], at least thirty (30) subjects required for correlational research to investigate relationship between variables and at least 10% of the accessible population is required for descriptive research. Based on this argument, the researcher collected data from 35 teachers in 11 (>50%) schools of Makadara Sub- County in Kenya.
The study sought the teachers input in assessing the reliability and speed of computer systems, adequacy of infrastructure and the impact that this had on both their students’ interest and improved academic performance. The input from teachers was solicited through questionnaires and converted into numeric values by use of Likert scale.
For each of the seven (7) schools visited, individual responses obtained through questionnaires were used to generate both Digitization index and Digitization impact index. This was done by computing the percentage of arithmetic mean obtained from 5-point Likert scale. Based on the scale, the maximum rating for each indicator was five (5) and the lowest rating was one (1). Therefore, the maximum possible sum of the five identified indicators was 5X5=25. The sum of the levels was then expressed as a percentage to the maximum possible sum (25) to obtain an index for each school. For instance, if an individual respondent rated Learner interest = 3, Learner improvement =3, Speed of information access = 4, Ease of system use =3 and Decision making speed =2, then the ICT Integration index can be computed as follows:
During data analysis, digitization index was treated as independent variable while academic performance was treated as a dependent variable. The internal consistency of the questionnaire was tested by use of Cronbach Alpha measure and found to have the acceptable value of 0.735. Correlation analysis was then carried out to assess the strength and the direction of association between variables [15] while linear regression analysis were used to develop the proposed model.
6. Results
Table1 presents shows results from the seven (7) schools, where variables X1, represents Country’s’ Digitization index, and Y represents digitization impact on learners behavior.
Table1: Digitization index (X1) and Digitization Impact index (Y)
| Digitization index (X1) | Digitization Impact index (Y) |
| 64 | 44 |
| 80 | 80 |
| 80 | 76 |
| 72 | 92 |
| 92 | 60 |
| 68 | 72 |
| 52 | 52 |
Pearson correlation results from the seven (7) schools’ sample showed that Digitization index was positively related to digitization impact with a correlation coefficient of 0.38. This is shown in Figure 2.
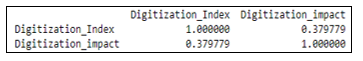 Figure 2: Correlation between digitization index and digitization impact
Findings from Sklearn library that is implemented in python programming language revealed that academic slope coefficient (b1) was approximately 0.49 while the intercept coefficient was 32.20. The two computed coefficients were then substituted in the regression equation to formulate the empirical model that is shown in Figure 3. The model means that for every 0.49 increase in the digitization index there is one unit increase in the academic slope.
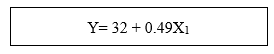 Figure 3: The developed empirical model
For the purpose of enhancing understanding Seaborn and Matplotlib packages were used to visualize the developed model from the seven schools sample. The results are shown as shown in Figure 4.
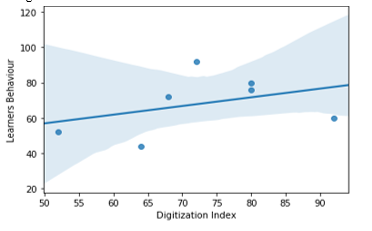 Figure 4: Visualization of the developed empirical model
7. Conclusion and Future Work
Findings from this study reveal that Digitization index of secondary schools can be measured using five indicators. That is, (i) affordability, (ii) systems reliability, (iii) systems speed, (iv) usability and (v) digital skill. In addition, linear regression equation can be used as an index for measuring the impact of digitization on both the academic performance and service delivery. Metrics for measuring such an impact include (i) Learners interest, (ii) learner improvement, (iii) speed of information access, (iv) decision making speed, and (v) ease of system use
From the reviewed literature it was observed that digitization has a positive impact on academic performance, interest and enthusiasm, ease of system use, and decision making process [5, 12]. On the other hand, the evaluation results of the proposed model showed that there is positive correlation between digitization and academic the effect on same indicators. Therefore, it can be concluded that the proposed model is consistent with findings of [5, 12].
Further research can be conducted to explore other measures for assessing digitization impact. The generalization of the proposed model can be evaluated by testing it in other education contexts like colleges and universities.
Conflict of interest
The authors declare that there is no conflict of interests in relation to the publication of this paper.
- R. Bisaso and A. Visscher, “Computerised School Information Systems Usage in an Emerging Country – Uganda,” in Information and Educational Management in the Knowledge Society, New York,USA: Springer, 2005, pp. 81–98.
- M. Shah, “Impact of management information systems (MIS) on school administration: What the literature says,” in 5th World Conference on Educational Sciences – WCES 2013, Rome,Italy, 2013, pp. 2799 – 2804.
- A. B. Youssef and M. Dahmani, “The Impact of ICT on Student Performance in Higher Education: Direct Effects, Indirect Effects and Organisational Change,” Univ. Knowl. Soc. J. RUSC,vol.5,no1, 2008.
- R. Katz, P. Koutroumpis, and F. M. Callorda, “Using a digitization index to measure the economic and social impact of digital agendas,” emeraldinsight, vol. 6, no. 1, pp. 32–44, 2014.
- F. K. Kisirkoi, “Integration of ICT in Education in a Secondary School in Kenya: A Case Study,” Lit. Inf. Comput. Educ. J. LICEJ, vol. 6, no. 2, 2015.
- VSNU, “Digitisation in academic education.” VSNU Association of Universities,the Netherlands, 2017.
- N. Camara and D. Tuesta, “DiGiX: the Digitization Index.” BBVA Research, 2016.
- R. Katz, K. Pantelis, and M. C. Fernando, “Using a digitization index to measure the economic and social impact of digital agendas,” Emeraldinsight, vol. 16, no. 1, pp. 32–44, 2014.
- K. Sabbagh, B. El-Darwiche, R. Friedrich, and M. Singh, “Maximizing the impact of digitization,” Booz&Company, 2012.
- P. Hague and N. Hague, “Customer Satisfaction Surveys & Research: How to Measure CSAT.” B2B International, n.d.
- N. Bitner and J. Bitner, “Integrating Technology into the Classroom: Eight Keys to Success,” Jl Technol. Teach. Educ., vol. 10, no. 1, pp. 95–100, 2002.
- K. Khemani, C. Hagen, B. Ross, and A. K. Jamjourm, “Digital School.” ATKearney, 2013.
- L. . Gay and P. . Diehl, Research Methods for Business and Management. Macmillan, 1992.
- R. Hill, “What Sample Size is ‘Enough’ in Internet Survey Research?,” vol. 6, no. 3–4, 1998.
- O. Mugenda and A. Mugenda, Research methods. Quantitative and Qualitative approaches. Nairobi. Nairobi: Africa Centre for technology studies, 2003.